
Quick Answer: Sellvia’s staged commission allocation can create a large difference between economic profit and usable cash. Under the current commission workflow, an order can move from Pending to Incoming for up to about 72 hours, after which up to 75% of the commission may become Available while the remaining portion can stay in a validation window for up to 125 days. A store can therefore look profitable on paper while still needing outside working capital to process new orders, fund ads and absorb payout fees. The correct way to plan is to model Available cash separately from total commission.
The liquidity problem in one sentence
Profit answers whether the business model creates value. Liquidity answers whether the business has enough usable cash today to keep operating. Those are different questions. A store can have positive contribution margin on every order and still run short of cash when part of its commission is not yet Available.
For Sellvia, that distinction matters because commission passes through states rather than becoming immediately withdrawable. The useful financial model is therefore not simply sales minus costs. It is a timing model that tracks when cash leaves the operator, when commission becomes Available, when the validation portion is released, and when a payout actually reaches the bank.
Current commission timing to model
Sellvia’s current Terms of Use describe Pending, Incoming and Available Commission. Incoming can remain in verification for up to 72 hours. The terms also describe staged allocation: typically up to 75% can transition to Available after the standard Incoming period, while the remainder may await allocation during a validation window of up to 125 days. The exact percentage and duration can vary under the terms, so 75/25 and 125 days should be treated as a planning case rather than an unconditional promise.
| Stage | Planning meaning | Liquidity treatment |
|---|---|---|
| Pending | Order exists but commission is not yet through processing | Do not count as usable cash |
| Incoming | Processed order is being verified, generally up to about 72 hours | Do not count as Available |
| Available | Allocated commission eligible for redemption subject to terms | Count only after payout costs and timing |
| Validation portion | Remaining staged allocation may wait up to 125 days | Track separately from operating cash |
A simple 75/25 planning model
Suppose a group of processed orders produces $1,000 of commission before payout costs. Under a 75/25 planning case, $750 may become Available after the normal Incoming period while $250 remains outside Available during the validation window. The business has not necessarily lost $250. The issue is timing: that amount cannot be treated as cash that can immediately fund the next cycle.
If the same pattern repeats every week, the amount waiting in validation accumulates. At $1,000 of weekly commission, a 25% staged portion equals $250 per week. After ten weeks, $2,500 may be represented by overlapping validation cohorts before releases begin to meaningfully offset new holds. This is why a growing store can experience more liquidity pressure than a smaller one even when margins improve.
Why growth can increase the cash requirement
Growth usually increases the number of orders that must be processed before the related commission becomes Available. If daily order volume doubles, the cash needed to support processing can rise immediately, while the release of older validation cohorts still follows their original timetable. This creates a temporary financing gap.
The mistake is to look at total dashboard commission and assume it can fund tomorrow’s orders. A safer approach is to maintain a separate operating-cash ledger. Only bank cash, processing credits that are actually usable, and Available commission that can be redeemed within the required timeframe should be included in near-term liquidity.

Build a cohort schedule instead of one balance
A cohort schedule groups commission by the date of the qualifying order or processing event. Each cohort has an initial Available portion and a validation portion. The validation portion receives an estimated release date based on the maximum planning window. This turns an opaque reserve balance into a calendar.
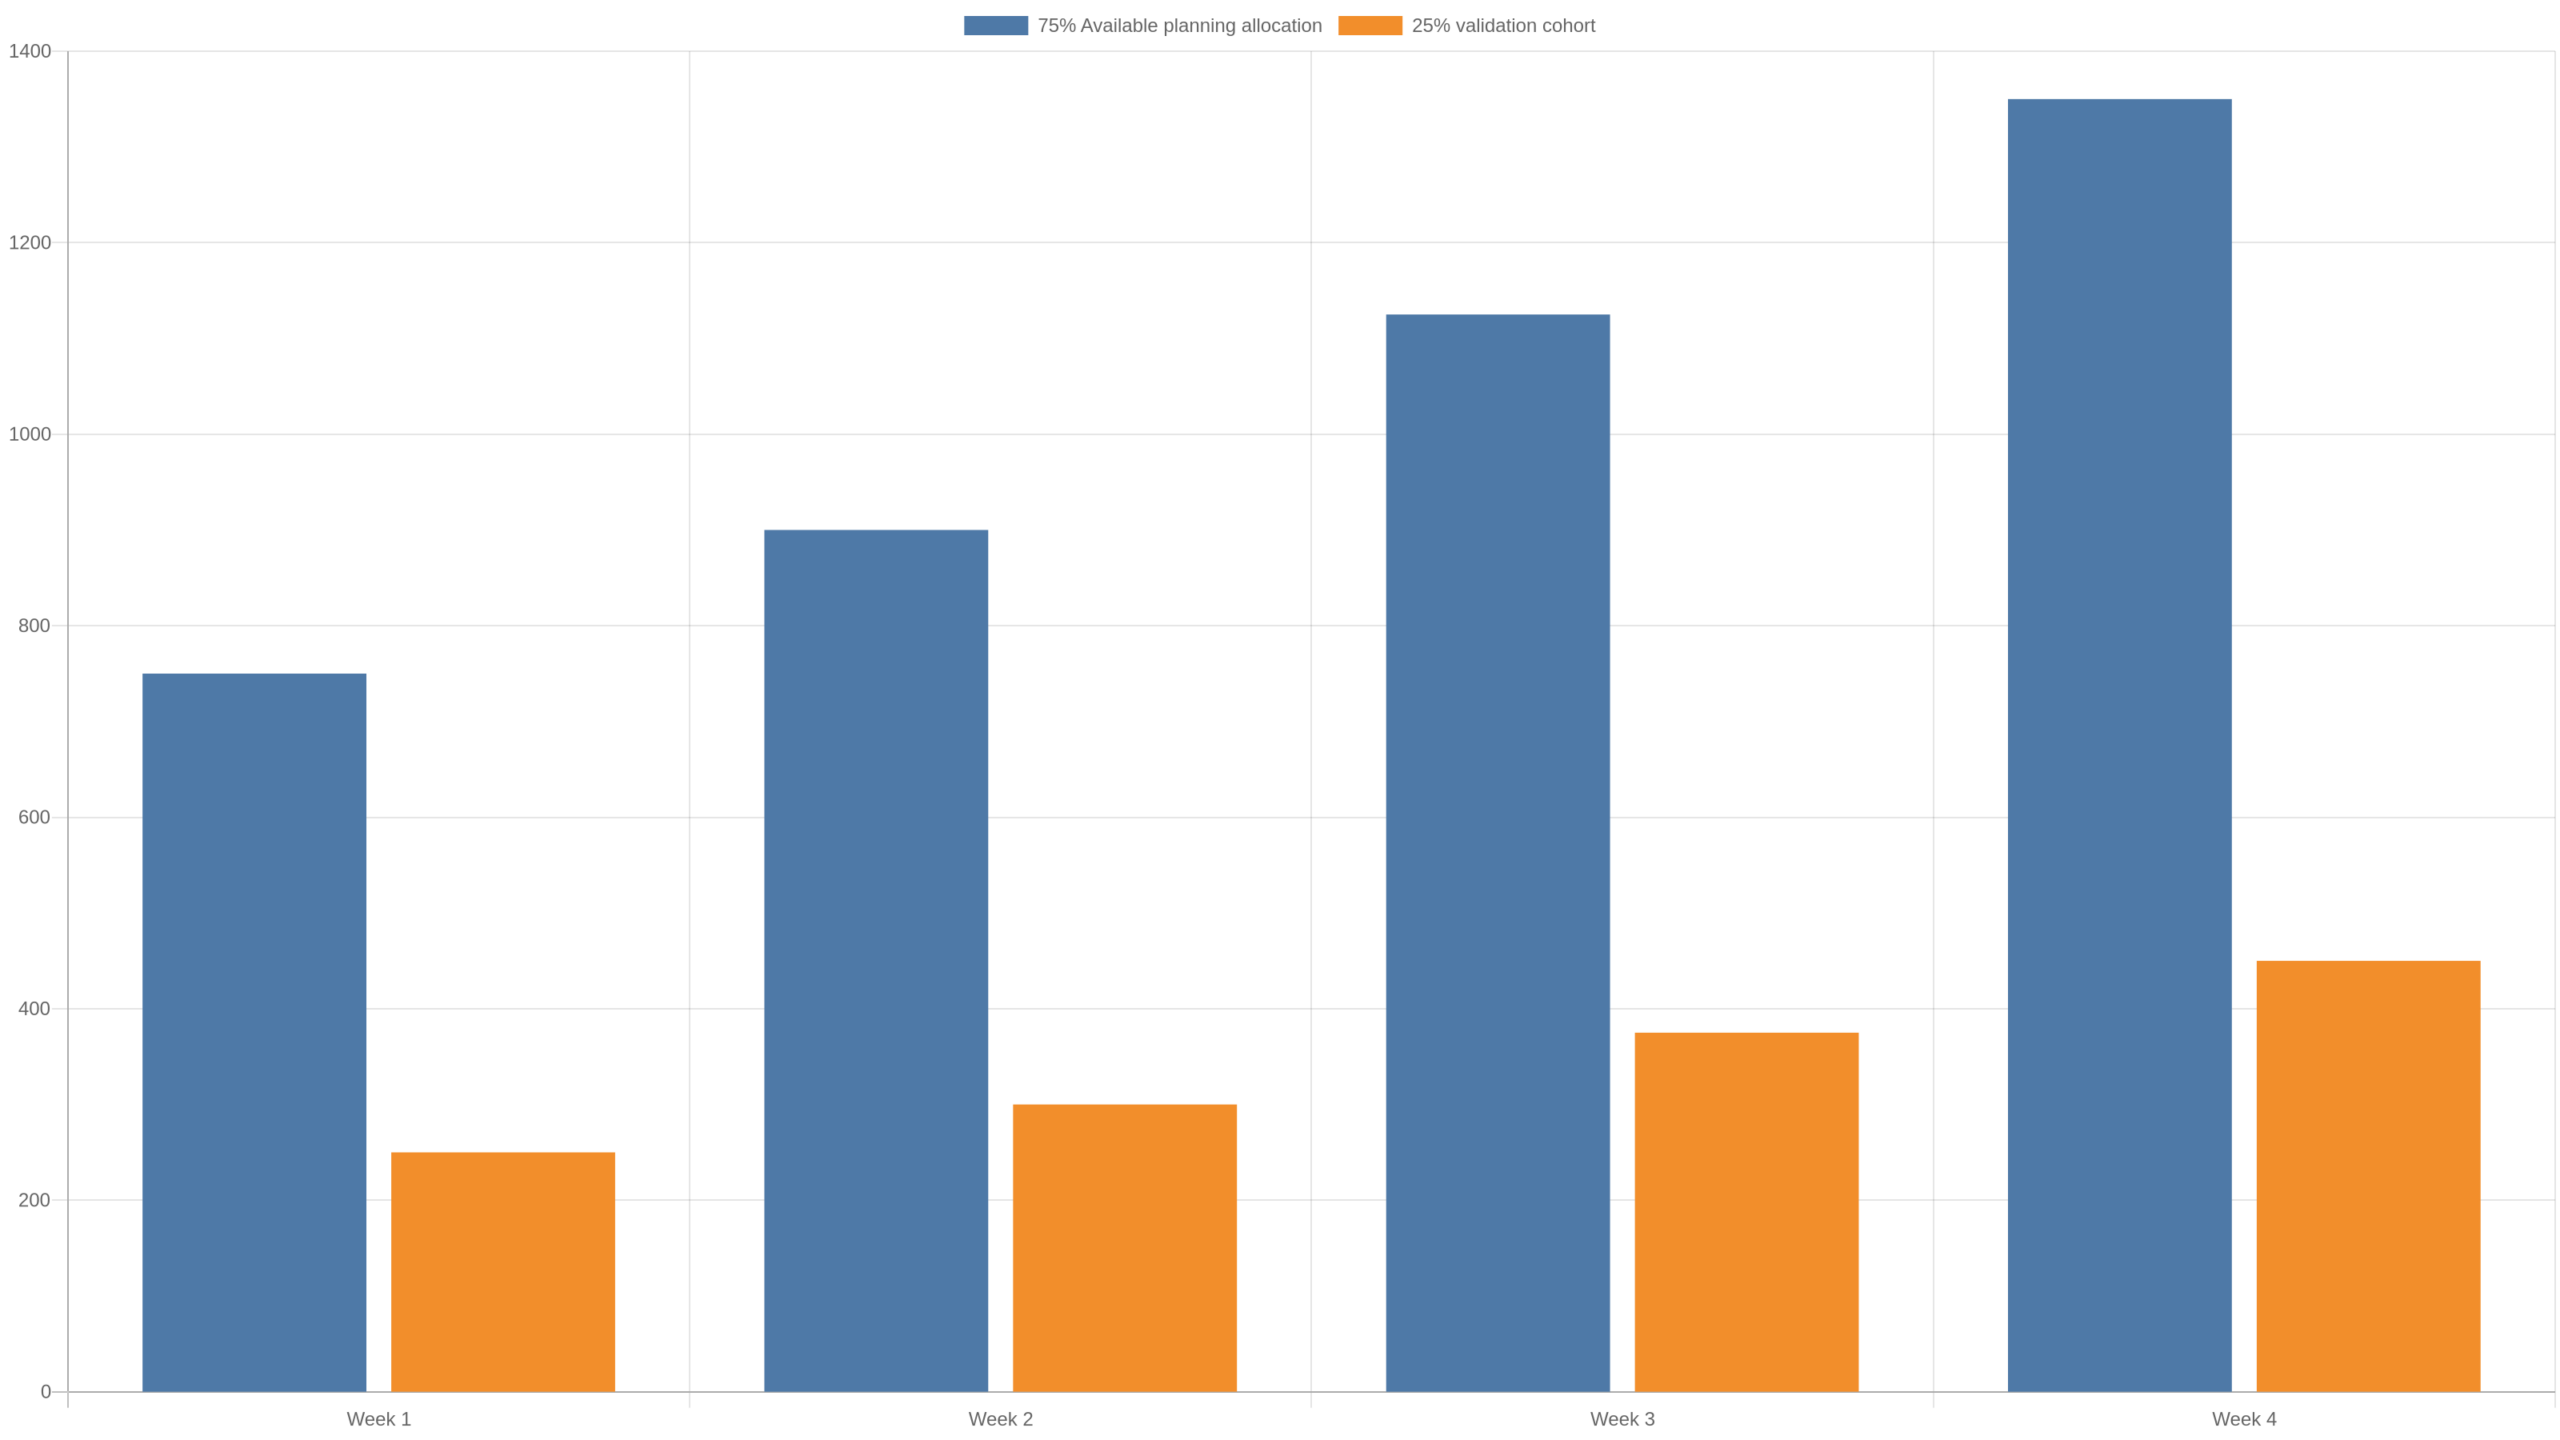
| Week | Commission | 75% planning allocation | 25% validation cohort |
|---|---|---|---|
| 1 | $1,000 | $750 | $250 |
| 2 | $1,200 | $900 | $300 |
| 3 | $1,500 | $1,125 | $375 |
| 4 | $1,800 | $1,350 | $450 |
After four weeks, this example has generated $5,500 of commission. The planning allocation is $4,125 and the validation cohorts total $1,375. That $1,375 should not be used to justify higher ad spend or a larger processing budget until it actually becomes Available.
The liquidity coverage ratio
One useful internal metric is liquidity coverage: usable operating cash divided by the next seven days of expected cash requirements. If a store has $1,500 of usable cash and expects $1,000 of processing, advertising and fixed costs during the next week, coverage is 1.5x. If usable cash falls to $700 against the same requirement, coverage is 0.7x and growth should probably be slowed until the gap is addressed.
Model payout friction separately
Available Commission is not identical to bank cash. Sellvia’s payout rules include a minimum redemption threshold and method-specific costs. Project records currently use a $100 minimum, with faster Express redemption carrying a materially higher percentage cost than a slower US bank route. A liquidity model should therefore have three lines: gross Available, expected payout fee, and net cash expected to reach the bank.
This distinction becomes especially important for small withdrawals. A fixed component in a payout fee can make frequent small redemptions expensive, while waiting for a larger payout preserves more value but delays usable cash. The optimal choice depends on the store’s cash coverage, not just the headline fee.
Scenario 1: stable store
Assume a store produces $4,000 of commission per month at a steady rate. Under the 75/25 planning case, roughly $3,000 enters the near-term Available stream and $1,000 joins validation cohorts. Once the business has operated long enough for old cohorts to mature, releases can begin to offset new validation allocations. The system may approach a rolling steady state, although individual releases and percentages can still vary.
Scenario 2: rapid growth
Now assume commission rises from $4,000 to $8,000 per month. The monthly validation allocation in the planning case rises from $1,000 to $2,000 immediately. Older cohorts were created when the store was smaller, so their eventual releases may initially be much smaller than the new amounts entering validation. This is the classic growth-cash-crunch pattern: accounting performance improves while liquidity tightens.
Scenario 3: volume falls after scaling
A decline in new orders can have the opposite timing effect. New validation allocations shrink while older cohorts continue reaching the end of their windows. That can temporarily improve cash availability even though current sales are weaker. This is another reason not to judge business health from one dashboard balance. Cash release timing can lag operating performance by months.
How much buffer should you keep?
There is no universal buffer because order-processing requirements, advertising intensity and payout method differ. A practical starting framework is to calculate the next 14 to 30 days of unavoidable operating cash needs, then add a contingency for faster-than-expected order growth. Do not include validation-window commission in the buffer.
- Estimate daily processing cash required at current order volume.
- Add committed advertising budgets and subscription costs.
- Subtract only cash and credits that are actually usable.
- Keep validation cohorts in a separate schedule.
- Stress-test the model at 1.5x and 2x current order volume.
- Recalculate after any material change in payout method or platform terms.
Do not call the validation portion profit that disappeared
The most accurate language is that part of commission may await allocation during a validation window. It is not useful to describe that amount as bank cash, but it is equally misleading to automatically treat it as a permanent expense. The financial model should show it as a separate timed asset-like expectation subject to the platform’s eligibility and adjustment rules, not as guaranteed receivable cash.
Separate economics from liquidity
For decision-making, maintain two views. The economics view asks whether revenue and commission exceed processing, advertising, subscription and payout costs. The liquidity view asks whether enough usable cash exists to fund the next operating cycle. A store can pass the first test and fail the second.
This separation also prevents a common scaling error: increasing ad spend because total commission is rising while ignoring that a growing share of the operator’s resources is tied up in processing and staged allocation. Scale should be constrained by the lower of demand capacity and liquidity capacity.
A 30-day operating dashboard
A useful weekly dashboard can contain seven numbers: new commission generated, Pending commission, Incoming commission, newly Available commission, amount entering validation, validation releases, and net bank cash after payout costs. Add processing cash used and ad spend beside them. This makes the timing chain visible without mixing states.
Stress test before increasing ad spend
Before raising daily ad spend, model what happens if orders increase by 50% while no validation cohort is released for the next 30 days. Then model a 100% increase. If either scenario drives liquidity coverage below 1.0x, the store is attempting to grow faster than its cash cycle can comfortably support.
Relationship to the self-funding point
The self-funding point is reached when recurring usable inflows can cover recurring operating outflows without repeated owner cash injections. Validation timing delays that point. A store may be profitable before it is self-funding because some commission is still moving through Incoming and validation stages. For the broader framework, see our guide to the Sellvia self-funding point and the companion analysis of the growth cash crunch.
Relationship to working capital
Working capital is the bridge between paying operating costs and receiving usable cash. The longer that bridge becomes, the more capital a growing operation needs. Our Sellvia working capital guide explains the broader calculation, while the cash conversion cycle article focuses on timing from order to usable cash.
Common modeling mistakes
- Counting Pending or Incoming commission as cash.
- Assuming every validation cohort releases on exactly day 125.
- Using gross Available instead of net bank cash after payout costs.
- Ignoring the cash required to process a surge in new orders.
- Scaling advertising from total dashboard balances rather than liquidity coverage.
- Failing to update assumptions when Sellvia changes terms or account-specific treatment.
Practical weekly routine
Every week, export or record the current balance states, create a new validation cohort for recent activity, mark any cohort that became Available, update the next 30 days of expected operating outflows, and recalculate liquidity coverage. If coverage is weakening, reduce discretionary spend before the store is forced into an emergency decision.
FAQ
Is 25% always held for exactly 125 days?
No. Sellvia’s current terms describe staged allocation as typically up to 75% becoming Available after the standard Incoming period, with the remaining portion potentially awaiting allocation for up to 125 days. The terms allow the percentage and duration to vary. Use 75/25 and 125 days as a conservative planning case, not a guaranteed schedule.
Should validation commission be included in profit?
For internal economics you may track expected commission separately, but do not treat the validation portion as usable cash or guaranteed payout. Liquidity planning should rely on cash and amounts actually Available under the platform rules.
Why can a profitable store still need more cash?
Because operating outflows can occur before the related commission becomes usable. Faster growth increases this timing gap when processing requirements rise immediately but validation releases lag behind.
What is the most useful metric to watch?
For short-term survival, liquidity coverage is more useful than total commission. Compare usable operating cash with the next one to four weeks of expected cash requirements.
A 125-day cohort forecast example
Consider a store that generates $500 of commission each week for eight weeks and then grows to $800 per week. Under a 75/25 planning assumption, the first eight weekly validation cohorts are $125 each. After growth, each new weekly cohort becomes $200. The important point is not the exact dollar amount but the shape of the schedule: old $125 cohorts eventually mature while new $200 cohorts continue entering validation. During that transition, releases from the smaller historical business may not keep pace with the amount associated with the larger current business.
A spreadsheet should therefore use one row per week rather than one cumulative reserve number. Columns can include commission date, gross commission, initial Available allocation, validation allocation, earliest planning release date, actual release date, adjustment if any, and final Available amount. When the real release occurs, replace the estimate instead of preserving the original forecast. This makes the model self-correcting over time.
Measure reserve intensity
Reserve intensity is a useful internal ratio: commission awaiting staged allocation divided by commission generated over a comparable recent period. It is not an official Sellvia metric, but it helps an operator see how much of recent economic activity is not yet usable. If $3,000 is awaiting allocation while the store generated $12,000 of commission over the period being compared, reserve intensity is 25%. If the ratio rises unexpectedly, investigate whether growth, timing, adjustments or account-specific treatment changed.
Do not use this ratio to predict a guaranteed payout. Its purpose is operational. A higher ratio means more of the store’s recent performance sits outside immediately usable liquidity. That should influence how aggressively the business commits to new advertising or other discretionary spending.
Model a no-release stress case
A conservative cash plan should include at least one period in which no validation releases are assumed. For example, take the next 30 days of expected order-processing cash, ad spend, subscription cost and payout friction, then assume every new order follows the normal staged-allocation pattern while no older validation cohort contributes usable cash during that month. If the store still maintains adequate liquidity coverage, the plan has meaningful resilience.
If the no-release case creates a cash deficit, the operator has several levers: slow advertising growth, keep a larger bank buffer, use less expensive payout timing when practical, or delay optional spending. The right response is not necessarily to stop growth. It is to align the growth rate with the speed at which usable cash replenishes operating capital.
Model a payout-delay stress case
Even after commission becomes Available, bank cash may not arrive instantly. A robust model adds the expected redemption method and transfer time rather than treating Available as cash in hand. If a slower, lower-cost route is used, the model should show the delay. If a faster route is used, the model should show the higher fee. This prevents the business from accidentally spending the same liquidity twice.
For planning, assign every expected cash inflow a confidence level. Bank cash already received is highest confidence. Available Commission that meets redemption conditions is lower because a request and transfer are still required. Incoming and validation amounts are lower again. A cash budget should become more conservative as the confidence of the inflow decreases.
How to decide whether growth is affordable
Before increasing volume, calculate the incremental cash requirement of the growth itself. If an extra 100 orders require an additional $1,200 of near-term processing and advertising cash while only part of the related commission becomes Available quickly, the store needs enough spare liquidity to bridge that difference. The correct question is not simply whether the extra orders are profitable; it is whether the business can finance the path from order creation to usable cash.
A practical rule is to approve a growth step only when the downside case still leaves a positive operating buffer. That downside case can combine lower-than-expected conversion, higher processing needs, no early validation release and the full expected payout cost. If the model survives those assumptions, scaling is less likely to create an avoidable cash emergency.
Keep assumptions and verified platform rules separate
Financial models become dangerous when estimates are presented as platform guarantees. Label every input. The 72-hour Incoming period and the staged-allocation language come from Sellvia’s current terms. The 75/25 split and up-to-125-day window are useful planning references but remain subject to the terms and account-specific treatment. Sales growth, conversion, ad cost and order-processing requirements are business assumptions and should be changed as real data arrives.
This separation also makes the spreadsheet easier to audit. When Sellvia changes a rule, update the verified-rule cells. When your store performs differently from forecast, update the operating assumptions. You can then see whether a cash-flow change came from the platform mechanics or from the business itself.
Use a minimum cash floor
Set a cash floor that the business is not allowed to spend on discretionary growth. One practical method is to reserve enough for the next two weeks of expected processing, fixed subscription costs and already-committed advertising. If usable cash falls below that floor, pause increases in ad spend until new Available Commission or bank cash restores the buffer. The floor should be based on actual recent order volume and recalculated as the store grows.
This rule creates discipline when dashboard balances look encouraging. It prevents validation-window amounts from psychologically becoming spendable money before they are actually Available. A cash floor is intentionally boring: it exists so a profitable growth opportunity does not force the owner into a liquidity emergency.
Reconcile forecast with actual releases
At the end of each month, compare the validation-release dates and amounts you forecast with what actually became Available. Record the variance instead of overwriting history. If releases consistently arrive earlier, later, larger or smaller than the planning case, adjust the forward model while keeping a conservative margin. This turns the spreadsheet from a static assumption into an operating forecast based on the store’s own history.
Do the same for payout timing and fees. A liquidity model is only useful when its assumptions are reconciled with real bank receipts. Over several cycles, this creates a much more reliable estimate of how much cash the store needs to support growth without relying on commission that is not yet usable.
Takeaway
The staged commission system is primarily a timing problem for financial planning. Model Pending, Incoming, Available and validation-window amounts separately. Build validation cohorts, forecast net bank cash after payout costs, and scale only when usable liquidity can support the next order cycle. That approach turns the 125-day window from a surprise into a measurable working-capital requirement.

Erick Borth is an ecommerce writer and digital platform researcher at Sellvia.biz. He covers Sellvia’s business tools, subscription options, built-in advertising features, order processing, analytics, and financial workflows. Erick focuses on presenting platform information in a clear and practical way, helping beginners understand how Sellvia operates, identify the costs involved, evaluate its features, and make informed decisions about starting and managing an online business.