
Quick Answer: A Sellvia store can become more profitable on paper while requiring more cash at the same time. The reason is timing: growth increases the number of orders that must be processed before all prior commissions have necessarily become usable cash. I modeled the effect below using clearly labeled assumptions rather than pretending they are account results. The key number is not revenue alone – it is the peak amount of operating cash tied up between order processing and cash becoming available.

What I Tested for This Analysis
For this article I checked Sellvia’s current public pricing and store offer, then built a cash-flow model around the operating sequence rather than relying on headline revenue. Sellvia currently advertises a 14-day trial followed by a $39 monthly entry plan, and its current public store offer describes digital products with margins commonly presented in the 50-70% range. Those are platform-level reference points. The order counts, selling prices, processing costs and ad spend in my scenarios below are assumptions used to isolate the cash effect of growth – they are not claimed results from a live store.
Why Growth Can Create a Cash Crunch
The basic mechanism is simple. A customer order can create an economic margin, but the store still needs enough available operating capital to process the next wave of orders. If orders accelerate faster than previously earned cash becomes reusable, the gap expands. This is a working-capital problem, not necessarily a profitability problem.
I use this formula:
Peak processing capital = maximum cumulative processing outflows – reusable cash inflows available by that point.
That distinction matters. Revenue measures sales. Contribution margin measures economics. Available cash determines whether the next order cycle can actually be funded.
A Simple Baseline Model
To make the mechanics visible, I modeled a $50 customer order with a $20 processing cost. That leaves a modeled $30 gross spread before advertising, subscription costs, payment-related charges and other operating expenses. Again, these are scenario inputs, not a promise of what any store will achieve.
| Modeled input | Value |
|---|---|
| Customer order value | $50 |
| Processing cost | $20 |
| Gross spread before other costs | $30 |
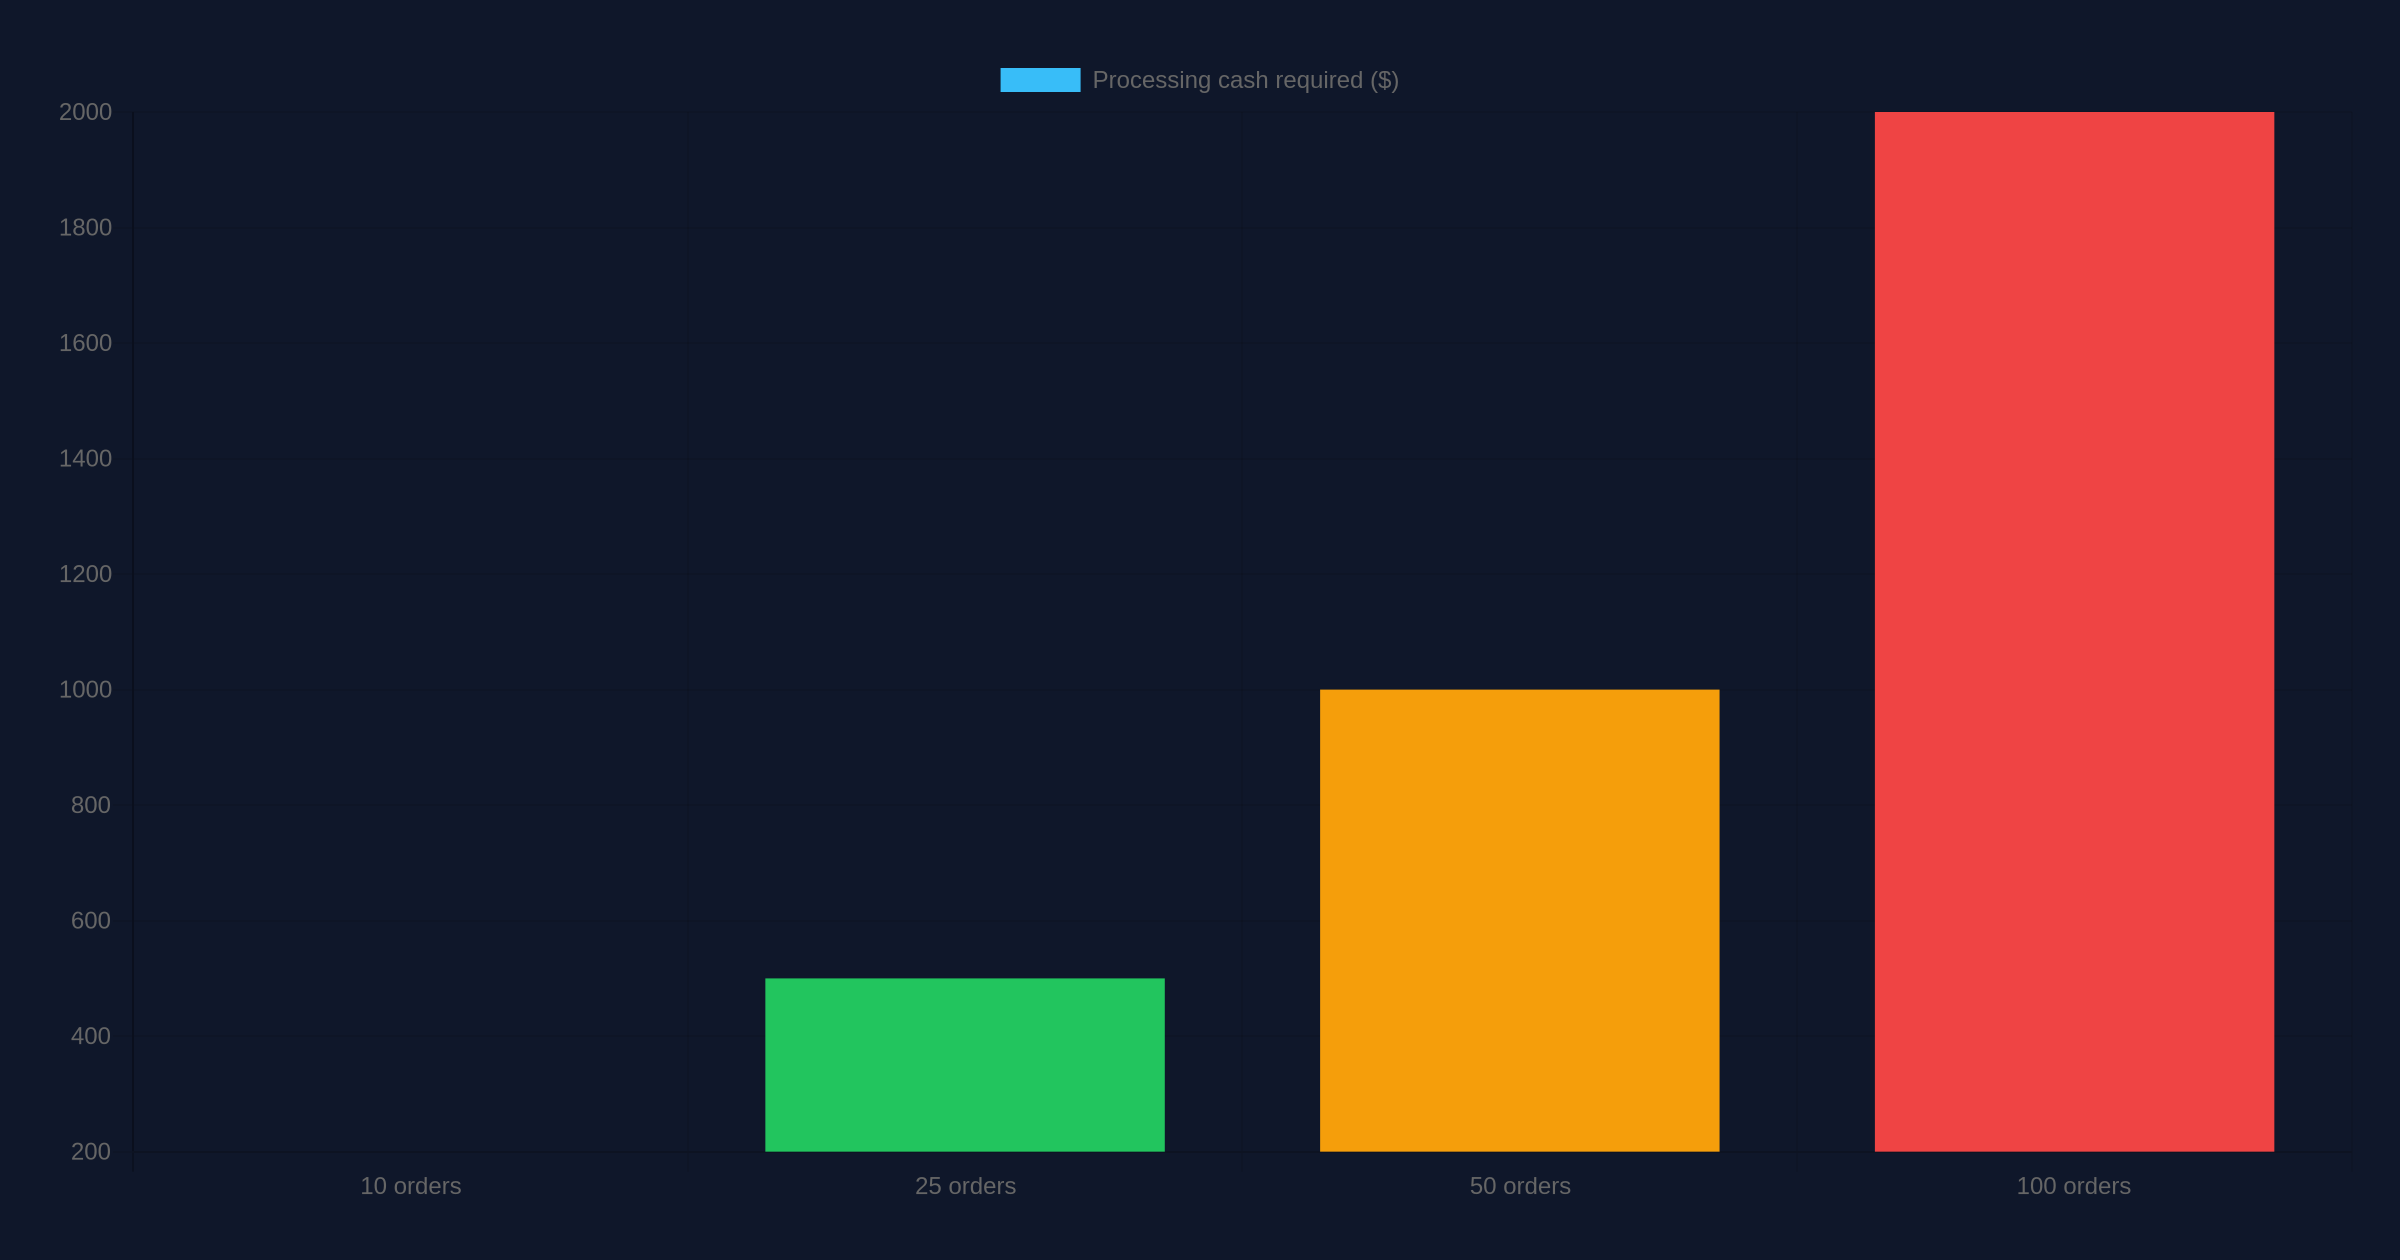
| 10 orders processed | $200 cash required |
| 25 orders processed | $500 cash required |
| 50 orders processed | $1,000 cash required |
| 100 orders processed | $2,000 cash required |
The important observation is that doubling order volume doubles the processing cash requirement when cost per order stays constant. A store that can comfortably fund ten orders may be unable to fund fifty orders immediately even though every modeled order has positive gross economics.
Scenario 1: Stable Volume
Suppose the store processes 10 orders per week. At $20 of modeled processing cost per order, each weekly batch requires $200. If usable cash from earlier batches arrives before the next $200 must be committed, the same pool of capital can circulate repeatedly. The business may only need a modest buffer above one normal order cycle.
This is the comfortable state: volume is predictable, cash recycling roughly matches new obligations, and there is time to see whether advertising and conversion economics remain healthy.
Scenario 2: Orders Double Before Cash Recycles
Now assume the store moves from 10 orders to 20 orders in the next comparable period. Processing demand rises from $200 to $400. If the first cycle’s cash has not yet become reusable, the operator may need to fund both layers from external operating cash. Instead of thinking, ‘sales doubled, so cash is better,’ the correct question is, ‘how much of the prior cycle is actually available to finance the new one?’
In the most conservative version of this modeled example, none of the first $200 has recycled before the second $400 commitment. Peak processing capital then reaches $600. The store can still be economically attractive, but growth has tripled the temporary cash commitment compared with the original $200 week.
Scenario 3: Rapid Three-Step Growth
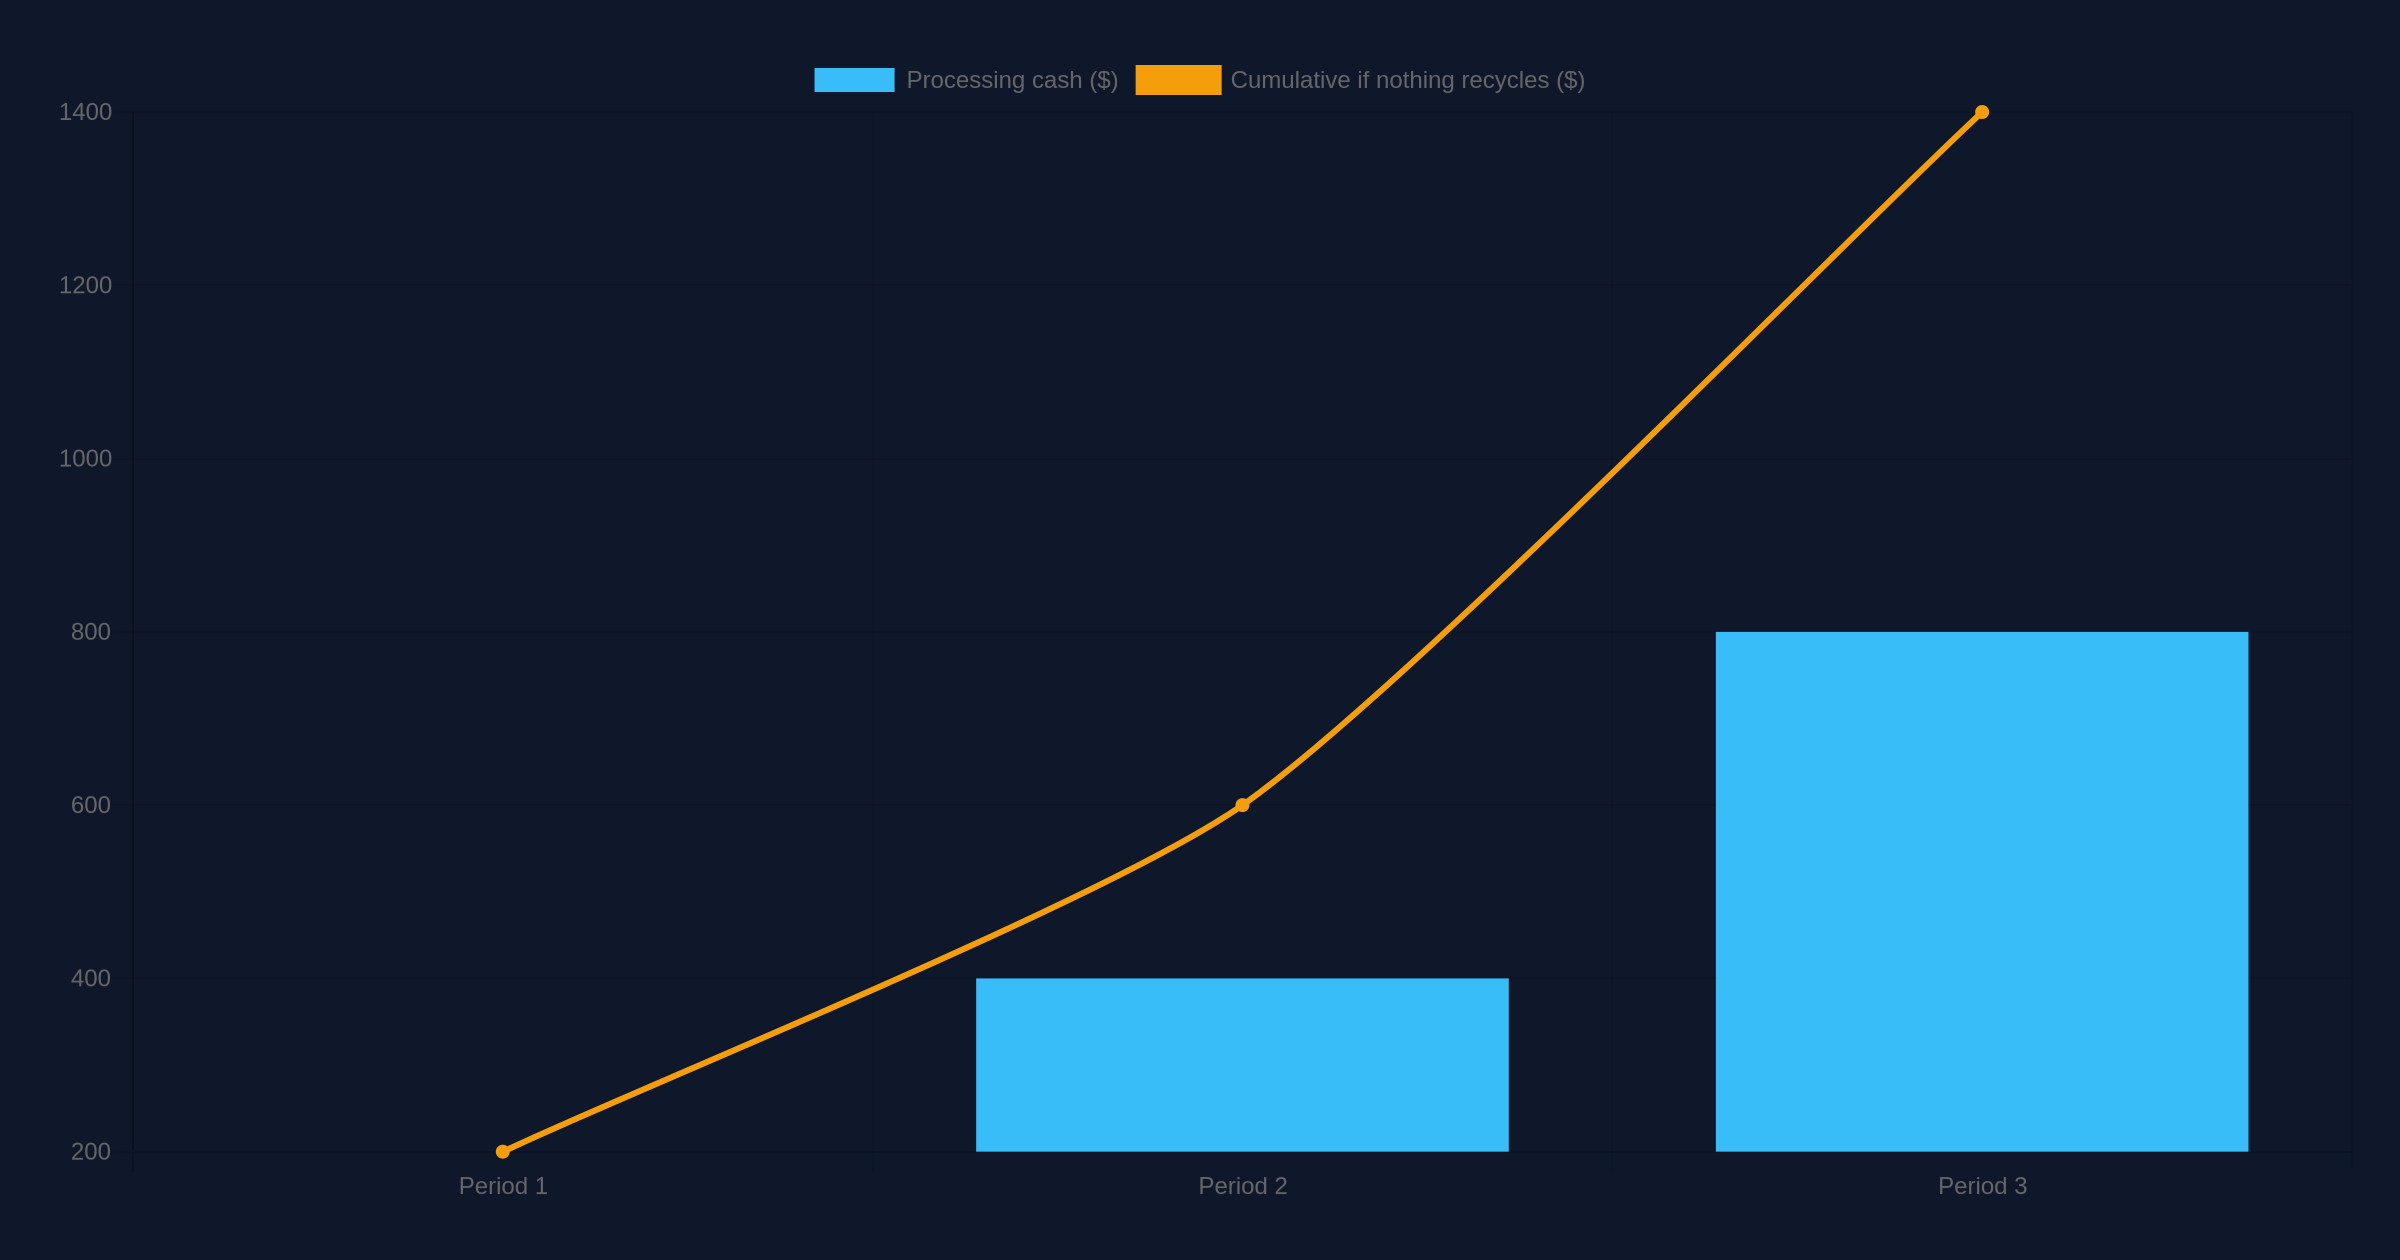
I then stress-tested 10, 20 and 40 orders across three consecutive operating periods. At $20 processing cost per order, the batches require $200, $400 and $800. If none of those commitments has recycled by the point the third batch must be funded, cumulative processing capital reaches $1,400.
| Period | Orders | Processing cash | Cumulative cash if nothing has recycled |
|---|---|---|---|
| 1 | 10 | $200 | $200 |
| 2 | 20 | $400 | $600 |
| 3 | 40 | $800 | $1,400 |
This is the growth cash crunch in its clearest form. The modeled store has not become less profitable per order. It simply has more cash tied up in the operating cycle at one time.
Partial Cash Recycling Changes the Picture
The conservative examples above intentionally assume no recycling so the risk is visible. Real planning should model partial recycling. If $150 from earlier activity is genuinely usable before a $400 batch must be processed, the incremental outside cash requirement is $250 rather than $400. If $350 is reusable, only $50 of additional processing capital is needed.
This is why I prefer a rolling cash schedule to a simple profit statement. For every period, list beginning available cash, new processing commitments, advertising outflow, subscription and service costs, cash that becomes available, withdrawals, and ending available cash. The lowest point in that schedule is the number that determines whether the growth plan is financeable.
Advertising Can Amplify the Gap
Processing capital is only one side of the cash requirement. Growth normally requires traffic. If advertising is increased at the same time as order volume, two cash demands can rise together: acquisition spend and order-processing cash.
For example, imagine a modeled period with $400 of processing cash and $300 of advertising. The immediate operating outflow is $700 before considering fixed subscription costs or any other charges. If the next growth step requires $800 of processing and $500 of advertising, the next operating commitment becomes $1,300. Positive unit economics do not remove the need to have that money available at the right time.
Sensitivity Analysis: Processing Cost Matters
The cash crunch is highly sensitive to processing cost per order. At 50 orders, a $10 processing cost requires $500. At $20, it requires $1,000. At $30, it requires $1,500. That is why I would never forecast required capital using order count alone.
| Orders | $10 cost/order | $20 cost/order | $30 cost/order |
|---|---|---|---|
| 10 | $100 | $200 | $300 |
| 25 | $250 | $500 | $750 |
| 50 | $500 | $1,000 | $1,500 |
| 100 | $1,000 | $2,000 | $3,000 |
The Growth Rate Matters as Much as the Margin
A high gross margin can still coexist with a severe temporary cash requirement if volume expands quickly. Conversely, a slower growth rate gives earlier cash more time to recycle. This produces an important planning rule: the faster I model order growth, the larger the liquidity buffer I want to see.
This connects directly with our Sellvia liquidity buffer analysis, the working capital guide, and the cash conversion cycle model. Those pieces explain the buffer, the capital pool and the timing cycle separately; this article focuses on what happens when volume accelerates.
A Practical Growth-Capital Formula
For planning, I use a conservative formula:
Required growth capital = peak un-recycled processing commitments + planned ad outflows + fixed costs due during the gap + safety buffer.
The safety buffer is deliberately separate. Forecasts are rarely exact. Conversion rates move, order values vary, advertising performance changes, and the timing of cash availability may not match a spreadsheet perfectly. A plan that only works when every assumption lands exactly on target is fragile.
How I Would Build the Buffer
I would start with the largest expected processing batch over the next 30 days. Then I would add any earlier batch that may still be unrecycled when that peak arrives. Next, I would add committed advertising for the same window and fixed charges due before the modeled cash recovery. Finally, I would add a contingency amount rather than assuming a perfect operating cycle.
For example, if the peak batch needs $800, $300 from a prior batch is still tied up, planned advertising is $500 and fixed costs due in the window are $39, the modeled exposure before contingency is $1,639. A 20% planning cushion would add about $328, producing a target buffer of roughly $1,967. The 20% is a planning assumption, not a Sellvia requirement.
When Growth Is Actually Self-Funding
The cash crunch begins to ease when cash generated by prior order cycles becomes available quickly enough and in sufficient quantity to finance new processing commitments and acquisition spend. That point is more useful than simply asking whether cumulative revenue is rising.
A self-funding growth cycle has three characteristics: reusable cash from prior cycles covers most or all new variable costs; the business can maintain a safety buffer after those commitments; and growth does not depend on continuously adding outside capital. I will treat that threshold separately in the next financial model because it deserves its own calculation.
Warning Signs That Growth Is Running Ahead of Cash
- Orders are increasing but available operating cash is falling.
- New processing commitments are being funded primarily with fresh outside money.
- Advertising is scaled before earlier cohorts have produced reusable cash.
- The model uses revenue or pending balances as though they were immediately spendable cash.
- There is no reserve for a slower-than-expected cash cycle.
- A small change in processing cost per order creates a large funding shortfall.
A Better Weekly Financial Scorecard
Instead of watching sales alone, I would track seven numbers every week: orders processed, average processing cost, total processing cash committed, ad spend, cash newly available, ending available cash and the next seven days of expected commitments. I would also calculate a simple coverage ratio:
Cash coverage ratio = available operating cash / next-cycle expected cash commitments.
A modeled ratio of 1.5 means $1.50 of available cash for each $1.00 expected in the next cycle. A ratio below 1.0 means the plan requires another funding source unless cash becomes available before the commitments are due. This is not an official Sellvia metric; it is a planning tool.
What This Means for Profitability
The growth cash crunch should not be confused with a loss. A store can have positive contribution margin and still face a temporary liquidity shortage. The reverse is also true: having cash available does not prove the economics are profitable. Both dimensions must be measured.
Our Sellvia order economics model is the better place to evaluate the economics of an individual order, while the break-even analysis focuses on the sales level needed to cover costs. Here, the question is narrower: can the business finance the timing gap created by growth?
Frequently Asked Questions
Can more Sellvia orders require more cash even if each order is profitable?
Yes. In a modeled cash-flow cycle, more orders create more processing commitments. If cash from earlier orders is not yet reusable, the peak amount of operating capital tied up can increase faster than the apparent profit.
Is revenue the same as available cash?
No. Revenue is an accounting or sales measure. Financial planning should distinguish customer sales, commissions or balances in intermediate states, and cash that is actually available for the next operating commitment.
How much growth capital should I keep?
There is no universal number. Model the largest overlapping processing commitments, planned advertising, fixed costs due during the same window and a contingency buffer. The correct amount depends on order volume, processing cost, growth speed and cash timing.
Should I stop scaling if available cash falls?
Not automatically. Falling available cash during a planned growth phase can be expected, but it should stay inside a predefined funding envelope. If the cash coverage ratio approaches the minimum you set, slowing the next growth step can be more rational than forcing volume.
Final Takeaway
The most important lesson from my model is that successful growth has two tests. The first is economic: does each additional order contribute enough margin after variable costs? The second is financial: can the store fund the larger operating cycle without running out of usable cash?
Sellvia’s integrated store and advertising workflow can make scaling operationally straightforward, but the financial discipline still belongs to the operator. I would not scale from 10 orders to 20, 40 or 100 based only on revenue. I would first model the peak unrecycled processing cash, advertising commitment and safety buffer. When those numbers remain comfortably funded, growth is far less likely to create an avoidable liquidity squeeze.
Comments

Erick Borth is an ecommerce writer and digital platform researcher at Sellvia.biz. He covers Sellvia’s business tools, subscription options, built-in advertising features, order processing, analytics, and financial workflows. Erick focuses on presenting platform information in a clear and practical way, helping beginners understand how Sellvia operates, identify the costs involved, evaluate its features, and make informed decisions about starting and managing an online business.
Leave a Reply