
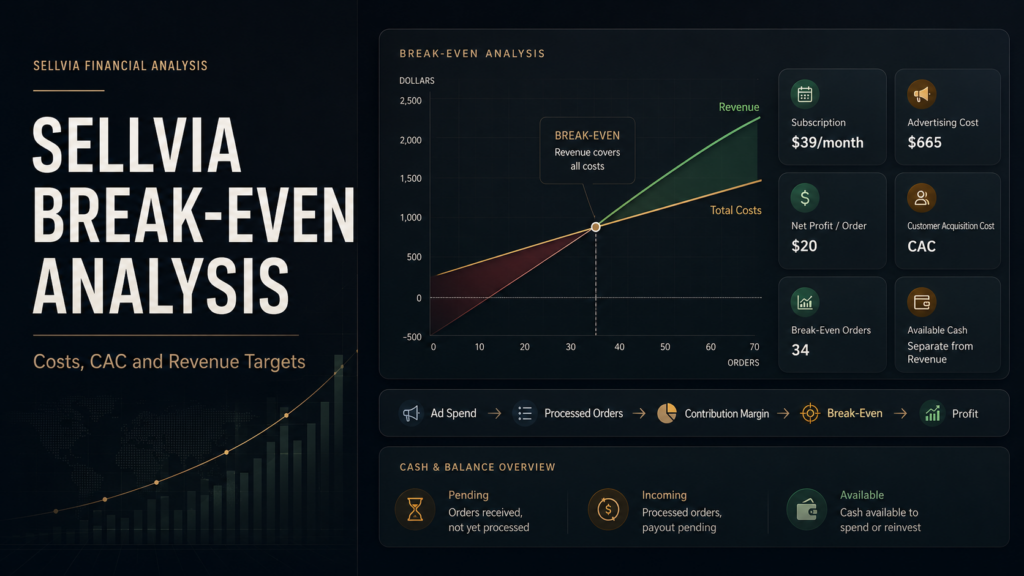
This Sellvia break-even analysis starts with a less flattering number than dashboard revenue: the amount of money that has actually been recovered after advertising, subscription charges, order processing, performance tiers, and cash-flow delays.
A Sellvia store can display orders and rising customer revenue while still sitting below break-even. That is not necessarily a dashboard error. It is what happens when gross sales are viewed before the costs required to produce those sales have been recovered.
I learned this distinction while tracking an active Sellvia store for Sellvia.biz. The customer-order total was useful for measuring demand, but it did not answer the question I cared about: had the store returned the cash put into it? To answer that, I had to separate processed-order profit from advertising spend, fixed charges, Pending and Incoming commission, Available commission, and the portion still subject to validation.
Sellvia breaks even when net profit from processed orders covers the advertising credits consumed, the $39 subscription, any performance-tier charges, and other real operating costs. For scalable unit economics, net profit per order must also stay above customer acquisition cost. Accounting break-even and cash-flow break-even can occur on different dates.
The central idea is straightforward: use contribution margin to judge the economics of each additional order, but use the complete period profit-and-loss calculation to determine whether a fixed advertising budget has actually been recovered. Mixing those two methods is one of the easiest ways to produce an unrealistically low break-even target.
In this analysis
What Break-Even Means for a Sellvia Store
“Break-even” is often used as if it were one dashboard number. For a Sellvia store, it needs a more precise definition because the platform combines a subscription, purchased advertising credits, order-processing requirements, optional weekly performance tiers, and several commission stages.
The current Sellvia offer is built around a ready-made store containing digital products such as guides, ebooks, templates, checklists, courses, and video lessons. Customers receive digital access without physical inventory, packaging, or shipping. Inside the partner dashboard, however, an order may still need to be processed before the related commission advances through the balance workflow. Digital delivery and partner-side order processing are therefore separate parts of the same transaction.
Access to the ready-made store, catalog, and platform tools depends on maintaining an active subscription. The base plan is advertised at $39 per month after a 14-day trial, with a possible $40 advertising credit for a new account. For a broader explanation of the operating model, see how Sellvia works from order to payout.
For this article, break-even means the point at which the economic value generated by processed orders equals the costs assigned to the same analysis period. The cash-flow version goes one step further: it asks whether the operator has recovered externally funded cash through money that is actually Available and ultimately withdrawn.
The Three Sellvia Break-Even Points
One of the most useful changes I made to my own tracking sheet was to stop treating break-even as a single milestone. There are three different thresholds, and a store may cross one while remaining below another.
1. Order-level break-even
An additional paid order is economically useful when the net profit generated by that processed order exceeds the advertising cost required to acquire the customer and any other variable cost not already included in the dashboard’s net-profit figure.
When this figure is negative, acquiring more customers at the same economics scales the loss. A larger order count cannot repair a negative contribution margin.
2. Monthly operating break-even
This asks whether the entire month has covered the advertising consumed during the period, the subscription, performance tiers, and other operating overhead. It is calculated from the complete monthly result rather than from one order in isolation.
A positive result means the analyzed month was operating-profitable. It does not automatically mean the original startup investment has been fully returned.
3. Cash-flow break-even
Cash-flow break-even is reached when cumulative withdrawals and usable Available commission have recovered the external cash invested, while enough liquidity remains to process new orders and fund the next operating cycle. It normally occurs later than accounting break-even because commission can remain Pending, Incoming, or subject to a validation period.
Important distinction: revenue, recorded commission, Available commission, and cash received in a bank account are four different measurements. The article tracks them separately.
Costs That Must Be Included in the Calculation
A defensible Sellvia break-even calculation uses actual charges and actual dashboard results. It should not assume that the $39 subscription is the entire operating cost.
Monthly platform subscription
The base subscription is $39 per month after the 14-day trial. A possible $40 advertising credit lowers the first cash contribution, but it is a one-time promotional benefit rather than recurring revenue. If commission is Available in the account, a renewal may also reduce the amount that can be withdrawn.
Advertising credits consumed
For economic analysis, record the value of advertising credits actually consumed during the period. A staged 30-day example can be calculated as follows:
- Days 1–4: 4 × $10 = $40
- Days 5–9: 5 × $15 = $75
- Days 10–19: 10 × $20 = $200
- Days 20–29: 10 × $30 = $300
- Day 30: 1 × $50 = $50
If the initial $40 credit is applied in full, the account owner needs to purchase $625 of those credits. That explains the two figures correctly: $665 is the advertising value consumed; $625 is the purchased-credit amount after the one-time promotional credit.
Ads-credit purchase fee
Current official Sellvia Terms of Use describe a 28% service fee on purchases of Ads Credits. Dashboard implementation and account terms can change, so this should be verified at checkout rather than assumed. If the fee applies to a $625 credit purchase, the cash payment becomes:
Do not hide this distinction. A store can consume $665 of advertising, receive $40 as a promotional credit, and still pay $800 for the remaining purchased credits if the stated service fee applies. For current wording, review the official Sellvia Terms of Use and the amount shown inside the account.
Performance-tier charges
The weekly structure described in the dashboard has included Basic at $0, Plus at $19 for up to 100 orders, Advanced at $39 for up to 250 orders, Pro at $69 for up to 500 orders, and Elite at $99 for unlimited orders. Only include the tier actually active during each week. A store that needs Advanced for one peak week and Plus for the other three should record $39 + (3 × $19) = $96, not four weeks of Advanced by default.
Order-processing expense and processing capital
Order-processing expense affects the economic profit attached to an order. Processing capital is the temporary liquidity required to complete orders before related commission becomes Available. When the dashboard’s “net profit” already subtracts the direct order cost, do not subtract that same cost again from profit; track the cash requirement separately.
Other operating expenses
Include only real expenses: design tools, analytics, accounting, external advertising services, domain-related charges, or taxes where relevant. Avoid padding the model with hypothetical costs that were not actually incurred.
Commission validation and payout timing
A portion of attributed commission may not become Available immediately. This does not change order-level contribution, but it can delay cash-flow break-even and increase the operating buffer required. The distinction is explained in detail later in the article.
For the broader pricing structure, see our Sellvia pricing and real monthly cost breakdown.
Replace the example figures below with your own advertising budget, processed orders, order costs, subscription, Performance Tier, Risk Reserve and payout method using the Sellvia Profit and Break-Even Calculator .
Sellvia Break-Even Formulas
The cleanest way to avoid false break-even numbers is to decide which of the following questions you are answering.
Method 1: Did a fixed monthly budget pay for itself?
Use this retrospective method when the advertising cost has already been spent or committed for the period.
Round the order result up to the next whole order. This method shows how many processed orders were required to recover the complete budget for that month.
Method 2: Are additional paid orders scalable?
Use contribution margin when CAC is treated as a variable cost that accompanies every additional acquired customer.
This method does not add the same advertising budget again, because CAC has already allocated advertising to each acquired order. Adding both CAC and the full advertising budget would double-count the same cost.
Revenue conversion
A ratio method can also be used, but the numerator and denominator must come from the same cost model. For a contribution-ratio model:
Rule of thumb: use the fixed-budget method for the month’s actual profit-and-loss result. Use the CAC method to judge whether acquiring the next customer is economically sensible.
A Complete Worked Example
Consider a fictional month with the following recorded results:
- Subscription: $39
- Orders placed: 40
- Orders processed: 34
- Paid-acquired customers: 30
- Repeat or non-paid orders: 4
- Average order value: $38
- Total net profit from processed orders: $544
Step 1: Calculate average net profit
Step 2: Calculate the complete monthly result
The month is already above operating break-even by $55. The earlier conclusion that 34 orders were below break-even would be mathematically incorrect.
Step 3: Calculate fixed-budget break-even orders
The store processed 34 orders, three more than the 31 required. At a $38 average order value, fixed-budget break-even revenue was:
Step 4: Separate channel CAC from storewide blended advertising cost
Paid-acquisition CAC is $450 ÷ 30 = $15. That number should be used to evaluate the 30 paid-acquired customers. It should not automatically be assigned to the four repeat or non-paid orders.
For a whole-store period view, blended advertising cost is:
Blended contribution is therefore $16 − $13.24 = $2.76 per processed order. At that blended level, roughly 15 orders cover the $39 subscription. This second figure is a unit-economics threshold, not the number required to recover the already-spent $450 advertising budget.
Step 5: Compare accounting profit with usable cash
The $55 result is an accounting result for the period. It does not prove that $55 is already withdrawable. Some commission may still be Incoming or awaiting allocation under the validation terms, and the account may still require processing capital for new orders. Cash-flow break-even must therefore be tracked against Available commission and withdrawals, not against the monthly profit figure alone.
Four Realistic Break-Even Scenarios
The scenarios below deliberately show both calculation methods. “Fixed-budget break-even” asks how many orders recover the complete period cost. “Unit-economics break-even” asks how many contribution-positive orders recover fixed overhead when advertising is already represented by CAC.
Scenario 1: Weak advertising efficiency
- Processed orders: 10
- Average net profit per order: $12
- Advertising: $200
- CAC: $20
- Subscription: $39
The fixed-budget view says 20 orders would have been required to recover the already-spent $239 at $12 net profit per order. But that statement assumes the same $200 could somehow produce 20 orders. The scalable view reveals the real problem:
There is no viable scalable break-even point at the current CAC. More orders acquired at $20 each increase the loss. Acquisition efficiency or net profit must improve first.
Scenario 2: Viable orders and a profitable month
- Processed orders: 25
- Average net profit per order: $18
- Advertising: $300
- CAC: $12
- Subscription: $39
Fixed-budget break-even is ($300 + $39) ÷ $18 = 18.83, rounded up to 19 processed orders. The store reached 25.
Contribution after advertising is $18 − $12 = $6 per paid order. The unit-economics threshold for recovering the $39 subscription is $39 ÷ $6 = 6.5, rounded up to 7 contribution-positive orders. Both numbers are correct because they answer different questions.
Scenario 3: The staged 30-day advertising plan
- Advertising credits consumed: $665
- Promotional credit: $40
- Purchased credits: $625
- Illustrative cash paid if a 28% purchase fee applies: $800
- Subscription: $39
- Processed orders: 60
- Average net profit per order: $20
- Average order value: $38
- Advertising CAC based on credits consumed: approximately $11
The economic result based on advertising value consumed is:
If the current 28% service fee applies to the $625 purchased credits, the cash-outlay view is:
Fixed-budget break-even based on consumed advertising value is ($665 + $39) ÷ $20 = 35.2, rounded up to 36 orders, equivalent to approximately $1,368 in gross revenue at a $38 average order value.
Cash-outlay break-even including the illustrative ads-credit purchase fee is ($800 + $39) ÷ $20 = 41.95, rounded up to 42 orders, or approximately $1,596 in gross revenue.
The CAC contribution view is $20 − $11 = $9. At that unit margin, five paid orders cover the $39 subscription. Again, that five-order figure does not mean five orders recover the entire 30-day advertising purchase; advertising has already been allocated through CAC in that model.
If CAC rises from $11 to $14 while $665 in credits is consumed, the same budget produces roughly 47–48 customers instead of about 60. At 48 processed orders, the economic monthly result becomes (48 × $20) − $665 − $39 = $256. The store remains profitable in this illustration, but the surplus falls by almost half.
Scenario 4: Higher volume with a justified tier mix
- Processed orders: 200
- Average net profit per order: $16
- Advertising: $1,500
- CAC: $7.50
- Subscription: $39
- Tier mix: Advanced for one 138-order peak week ($39) and Plus for three weeks ($57)
- Total tier charges: $96
- Other overhead: $50
The peak-week detail matters. Without a week above the Plus capacity, four weeks of Advanced would not be justified merely by a 200-order monthly total.
Total fixed overhead excluding advertising is $185. Fixed-budget break-even is ($1,500 + $185) ÷ $16 = 105.31, rounded up to 106 orders.
Contribution after advertising is $16 − $7.50 = $8.50 per order. The unit-economics threshold for recovering $185 in fixed overhead is $185 ÷ $8.50 = 21.76, rounded up to 22 orders.
If average net profit falls by 10%, from $16 to $14.40, the monthly result becomes:
The store remains above break-even, but a 10% decline in per-order net profit removes $320 from the monthly result.
Scenario comparison
| Scenario | Orders | Net profit/order | Advertising | Fixed costs | Period result | Fixed-budget BE | Unit-economics conclusion |
|---|---|---|---|---|---|---|---|
| 1: Weak efficiency | 10 | $12 | $200 | $39 | −$119 | 20* | Negative contribution at $20 CAC; not scalable |
| 2: Viable orders | 25 | $18 | $300 | $39 | $111 | 19 | $6 contribution; 7 orders cover fixed cost |
| 3: Staged ad plan | 60 | $20 | $665 consumed | $39 | $496 | 36 | $9 contribution at $11 CAC |
| 4: Higher volume | 200 | $16 | $1,500 | $185 | $1,515 | 106 | $8.50 contribution; tier mix justified by peak week |
*The 20-order retrospective threshold assumes no additional advertising beyond the $200 already spent. At the stated $20 CAC, acquiring those extra orders would add cost, so the scalable model remains negative.
Advertising Efficiency Determines the Sellvia Break-Even Point
The subscription is fixed and relatively small. Advertising efficiency changes with traffic quality, conversion rate, creative performance, and the audience being reached. That makes CAC one of the most sensitive inputs in the model.
Assume $20 average net profit per processed order, $39 in monthly fixed cost, and 50 paid orders:
| CAC | Contribution/order | Unit BE orders | Result at 50 orders after $39 fixed cost | Interpretation |
|---|---|---|---|---|
| $8 | $12 | 4 | $561 | Healthy room for refunds and volatility |
| $12 | $8 | 5 | $361 | Workable, but less margin for error |
| $16 | $4 | 10 | $161 | Thin margin and highly sensitive |
The maximum sustainable CAC is not automatically equal to net profit per order. A store also needs enough contribution to cover fixed costs, refunds, disputes, and a desired profit. At 50 orders and $39 fixed cost, the mathematical no-profit ceiling before other adjustments would be approximately $20 − ($39 ÷ 50) = $19.22 CAC. Operating that close to the ceiling would leave almost no safety margin.
Increasing daily advertising before contribution is validated can multiply a weak result. Keeping the budget too small can create the opposite problem: too few conversions to estimate CAC reliably. I prefer to make scaling decisions from a rolling cohort with enough processed orders to smooth out one unusually cheap or expensive day.
Why Revenue Can Look Better Than the Real Result
This is worth a section of its own because it’s the single most common source of confusion I’ve run into, both in my own tracking and in questions from other store owners.
Say a Sellvia dashboard shows $5,000 in customer order revenue for a month. That figure is the full amount customers paid across all orders placed, whether or not those orders were processed, and before any cost is subtracted. It is not $5,000 of profit, and treating it as such is the fastest way to feel like a store is doing better than it actually is.
Work through what actually separates that $5,000 from spendable profit: some orders may be unprocessed and therefore not yet converted into net profit at all. Processed orders carry a processing cost that reduces the customer order total down to net profit per order. Advertising spend, which doesn’t appear anywhere in that $5,000 figure, still has to come out before contribution margin exists. The monthly subscription and any active weekly tier charge are fixed costs sitting entirely outside that revenue number. Even the portion that does qualify as genuine profit doesn’t all become Available immediately; some sits in Pending, some in Incoming for a short window, and some may be routed to Risk Reserve. Processing capital, the cash needed to keep processing new orders as they arrive, may need to be reinvested rather than withdrawn. And where applicable, refunds, disputes, or other adjustments reduce the final realized figure further still.
None of that means $5,000 in revenue is meaningless. It’s a sign that products are selling and traffic is converting, which matters. It just isn’t the number that answers “did I make money this month,” and conflating the two is where a lot of premature confidence, or premature panic, comes from.
Processing Capital and Cash-Flow Break-Even
A profitable order can still create an immediate cash requirement. Suppose 15 orders arrive over two days and each requires $14 of processing capital before its related commission progresses through the dashboard.
The $210 may already be reflected economically when the dashboard calculates net profit. It should not necessarily be subtracted from net profit a second time. But the operator still needs access to $210 now, while the related commission may remain Pending or Incoming.
This creates four distinct states:
- Profitable order: the expected net profit is positive after the direct order cost.
- Processed order: the operator has completed the required dashboard step and funded the processing amount.
- Available commission: the platform has allocated commission to the Available balance under its current terms.
- Withdrawn cash: a payout has been approved and received externally.
Cash-flow planning must account for the gap between these states. A store can show a positive monthly result while still requiring additional processing capital during a fast order burst.
How Pending, Incoming, Available, and Risk Reserve Affect the Result
The simplified dashboard sequence is generally: customer order → order processing → Pending → Incoming → Available → payout request. The customer’s digital product may be delivered automatically, but the partner’s commission still follows the platform’s processing and allocation rules.
The Incoming stage is commonly described as lasting about 72 hours. The minimum withdrawal threshold is commonly shown as approximately $100, with available payout methods depending on the account. These details affect liquidity, not the underlying demand represented by an order.
What is commonly called the Risk Reserve
For planning purposes, users often call the delayed portion a “Risk Reserve.” The current official Terms of Use describe it more precisely as progressive commission allocation: typically up to 75% may transition to Available after the standard Incoming period, while the remaining portion may await allocation during a validation window of up to 125 days.
The terms also state that commission still awaiting validation has not yet been fully earned or allocated and should not be described as customer funds being held in escrow. That legal distinction matters. In a personal spreadsheet, I still track the delayed portion in a separate “validation / reserve” column because it is not usable cash.
Numerical example
Suppose $2,000 of commission is attributed to processed activity. If 75% becomes Available after the normal Incoming stage:
The store should not treat $2,000 as immediately withdrawable, and it should not automatically record the $500 as a permanent loss. The conservative cash-flow view counts $1,500 as potentially usable, subject to the payout threshold and account conditions, and tracks $500 separately until its status changes.
Allocation percentages, validation duration, and payout eligibility can vary or change. Confirm the current wording in the official terms and the figures displayed in the active dashboard.
Sensitivity Analysis
Small changes in CAC or net profit can move the result much more than the $39 subscription. Using Scenario 3’s economic baseline—60 orders, $20 net profit per order, $665 of advertising credits consumed, and $39 fixed cost—the following changes illustrate the sensitivity:
| Change | Processed orders | Net profit/order | Advertising | Period result | Effect |
|---|---|---|---|---|---|
| Baseline | 60 | $20.00 | $665 | $496 | Reference case |
| CAC rises to about $14 with same ad credits | 48 | $20.00 | $665 | $256 | Fewer customers from the same budget |
| Net profit/order falls 10% | 60 | $18.00 | $665 | $376 | $120 less monthly profit |
| One $39 tier week is added | 60 | $20.00 | $665 | $457 | Fixed cost rises without changing contribution/order |
| 28% fee applies to $625 purchased credits | 60 | $20.00 | $800 cash paid | $361 | Cash break-even occurs later than economic break-even |
Refunds and disputes work differently because they can reduce realized net profit after the original sale. A useful conservative model includes a separate adjustment rate rather than assuming every processed order remains unchanged forever.
How to Build a Sellvia Break-Even Spreadsheet
A useful spreadsheet needs to keep economic performance, advertising efficiency, and liquidity in separate columns.
Inputs to record
- Analysis period
- Gross customer revenue
- Orders placed and orders processed
- Paid-acquired customers and repeat/non-paid orders
- Total direct processing costs
- Total net profit shown for processed orders
- Advertising credits consumed
- Promotional advertising credit used
- Cash paid to purchase Ads Credits, including any applicable service fee
- Subscription and performance-tier charges
- Other operating costs
- Pending, Incoming, Available, and validation/reserve amounts
- Withdrawals requested and withdrawals received
Calculated fields
If contribution per paid order is zero or negative, the unit-economics break-even formula has no useful positive answer. The store must improve CAC, net profit, or another variable before scaling.
I also recommend separate columns for advertising value consumed and cash paid for advertising credits. A promotional credit or purchase fee can make these numbers different even though both matter.
Common Calculation Mistakes
Treating gross customer revenue as personal income. This is the mistake that causes the most confusion, and it’s covered at length above. Revenue and profit are not the same figure.
Ignoring advertising spend entirely. Some early tracking sheets only capture processing costs and skip advertising because it’s paid from a different part of the dashboard. Advertising is usually the largest variable cost in the whole calculation.
Counting Pending and Incoming funds as immediately spendable. They’re real, but they aren’t liquid yet, and budgeting against them before they clear creates cash shortfalls.
Treating Risk Reserve as either fully available or permanently gone. Neither is accurate. It’s restricted, not lost, and it should be tracked as its own category.
Forgetting the monthly subscription. It’s a small number relative to advertising spend once volume grows, which is exactly why it gets overlooked, even though it’s a real recurring fixed cost every single month.
Ignoring weekly tier charges. Same issue as the subscription, compounded by the fact that tiers are billed weekly rather than monthly, which can make the true monthly total easy to underestimate.
Using total orders instead of processed orders. Unprocessed orders that get canceled contribute nothing to actual profit and shouldn’t be counted as if they had.
Calculating CAC from clicks rather than acquired customers. Cost per click measures traffic cost. It says nothing about conversion, and conversion is what actually determines whether that traffic was worth paying for.
Scaling advertising spend before contribution margin is positive. If the unit economics are already negative, a bigger budget just produces a bigger loss, faster.
Mixing fixed-budget and CAC formulas. If the full advertising budget is included in total costs, do not subtract CAC from each order again. If CAC is already used to calculate contribution per order, do not add the same advertising budget a second time.
Ignoring the cash required to process new orders. A store can be accounting-profitable and still short on the specific cash needed at the moment new orders need processing.
Assuming one profitable week means the whole initial investment has been recovered. A single strong week is a data point, not a milestone. Cumulative cash recovered is the number that actually answers that question.
Changing several variables at once. Raising the ad budget, switching tiers, and adding a new product pack in the same week makes it nearly impossible to tell which change actually moved the result.
How I Track Sellvia Break-Even in Practice
My own tracking sheet grew out of getting this wrong the first month, mostly by leaning too heavily on the dashboard’s revenue figure and not distinguishing it clearly enough from contribution and Available cash.
What I settled on: record daily order activity, separating the customer’s order total from the net profit figure shown after processing. Only processed orders go into the profit calculation; unprocessed ones sit in a separate column until they’re either processed or canceled. Advertising spend gets its own row, recorded independently of the profit figures, and I calculate CAC weekly rather than daily, since daily CAC swings around too much to mean anything on its own. Subscription and tier charges get logged on the exact date they’re charged, not averaged across the month. Pending, Incoming, Available, and Risk Reserve each get their own column, because collapsing them into one “balance” figure was exactly what caused my early confusion. And at the top of the sheet, I keep a running total comparing cumulative external cash invested against cumulative withdrawals received, which is the only number I actually trust to answer whether the store has broken even.
The most useful single figure turned out to be contribution margin per processed order, not gross store revenue. Revenue told me whether products were selling. Contribution told me whether selling them was actually worth the cost of acquiring the customer.
This is a personal tracking method, not financial advice, and it’s worth adapting to whatever level of detail actually helps you make decisions rather than just generating more numbers to look at.
Is Sellvia Profitable?
There’s no single answer that applies to every store, and any article claiming otherwise should be read skeptically. What the scenarios above show is that the outcome depends mainly on average net profit per processed order, customer acquisition cost, conversion performance, advertising discipline, refund and dispute rates, tier costs where applicable, the availability of processing capital, how long funds remain unavailable through Pending, Incoming, or Risk Reserve, and simply how accurately the operator is measuring all of this in the first place.
One observation that held up across every scenario here: the $39 subscription is rarely the largest variable once advertising activity picks up. Once a store is spending a few hundred dollars a month or more on ads, advertising efficiency and contribution per order have a far larger effect on where the break-even threshold sits than the subscription fee does. That’s a pattern worth internalizing, not a guarantee about how any particular store will perform.
Final Conclusion
There is no universal Sellvia revenue target. Two stores can report identical customer revenue and reach very different outcomes because their net profit per processed order, CAC, advertising-credit purchase cost, tier usage, and commission timing are different.
The correct sequence is:
- Calculate average net profit from processed orders.
- Record advertising credits consumed and the cash actually paid for them.
- Use the fixed-budget formula to determine whether the month recovered its complete cost.
- Use contribution after CAC to judge whether the next paid order is scalable.
- Track Available commission and withdrawals separately from accounting profit.
- Maintain enough processing capital to bridge the timing gap.
The most important practical lesson from this Sellvia break-even analysis is not to scale because revenue looks impressive. Scale only after contribution per paid order is positive, the full monthly budget is understood, and cash-flow timing can be supported without constantly adding external money.
Frequently Asked Questions
What is the Sellvia break-even point?
It’s the point where the cumulative contribution margin from processed orders equals the costs being recovered, whether that’s the cost of a single order, a month of operating expenses, or the full amount of cash originally invested. There are three distinct versions of this, covered above, and it’s worth knowing which one you’re actually asking about.
How much revenue do I need to break even with Sellvia?
It depends entirely on your net profit per order and your customer acquisition cost, which together determine contribution margin. Divide your recoverable fixed costs by that contribution margin to get a break-even order count, then multiply by average order value to get a revenue figure specific to your own numbers.
Is the $39 Sellvia subscription included in break-even?
Yes. It’s a recurring fixed cost that has to be recovered like any other, even though it’s usually small relative to advertising spend once a store is running ads at any meaningful scale.
Should advertising credit be counted as profit?
No. A trial coupon or advertising credit reduces the initial cash you need to put in, but it isn’t ongoing revenue and shouldn’t be counted as part of a recurring profit calculation.
Does the Sellvia Risk Reserve count as a loss?
Not automatically. The current official terms describe progressive commission allocation rather than customer funds being held. The delayed portion should be excluded from immediately usable cash and tracked separately until it is allocated, adjusted, or otherwise resolved under the account’s terms.
Why am I receiving orders but still losing money?
Usually because customer acquisition cost is close to or exceeding net profit per order, because advertising spend hasn’t been fully subtracted from the picture, or because fixed costs like the subscription and any tier charge haven’t been factored in against a still-small order volume.
Should Pending and Incoming balances be counted as profit?
Not as spendable profit, no. They may represent real earned amounts, but they aren’t liquid yet, and budgeting against them before they clear into Available status is a common source of cash-flow surprises.
How do I calculate Sellvia profit per order?
Start with net profit per order as shown after processing costs, then subtract customer acquisition cost to get contribution after advertising, which is the figure that actually determines whether that order was worth acquiring.
How many orders are needed to recover a $625 advertising budget?
Use the fixed-budget method. At $20 average net profit per processed order, recovering $625 of purchased advertising credits alone requires $625 ÷ $20 = 31.25, rounded up to 32 orders. Including the $39 subscription requires ($625 + $39) ÷ $20 = 33.2, rounded up to 34 orders. If a separate Ads Credit purchase fee applies, include that cash cost as well. Do not divide $625 by contribution after CAC, because CAC already contains advertising and would double-count it.
Can increasing the advertising budget reduce the time to break even?
Only if contribution per order is already positive. If it’s negative or marginal, a bigger budget just accelerates losses rather than shortening the path to profit. Validate the unit economics first, then scale.
Is Sellvia profitable for beginners?
It can be, but it isn’t automatic. Outcomes depend heavily on advertising efficiency, order economics, and how carefully the operator tracks contribution margin versus gross revenue, rather than on the platform alone.
What happens if contribution per order is negative?
There’s no meaningful positive break-even order count under those conditions. Selling more at the same negative unit economics increases the loss rather than closing the gap. The fix is improving customer acquisition cost or net profit per order, not simply increasing volume.
how Sellvia works Sellvia for beginners is Sellvia legit
32 responses to “Sellvia Break-Even Analysis”
-
the three break-even points breakdown is the clearest explanation of this i’ve seen anywhere. i was mixing fixed-budget and cac methods without realizing it and wondering why my numbers never matched
-
finally someone separated accounting break-even from cash-flow break-even. i hit “profitable” on paper in month two but still felt broke because half my commission was sitting in risk reserve
-
the worked example with 34 processed orders is genuinely useful. thought i was below break-even because i was only looking at total order count instead of processed orders
-
same exact experience. accounting profit and actual cash in the bank are not the same thing at all in the first couple months
-
-
the ads-credit purchase fee example with $625 turning into $800 cash paid is the kind of detail that should be shouted from rooftops, not buried in a help article
-
appreciate the distinction between blended advertising cost and paid-channel cac. i was assigning my whole ad budget to paid customers and ignoring my repeat orders completely, which skewed everything
-
this level of detail is rare for anything about sellvia. most content is either “it’s a scam” or “i made $500 today” with zero actual math shown
-
scenario 1 with negative contribution at $20 cac hit close to home. more orders at that acquisition cost just meant a bigger loss, exactly like described
-
the sensitivity analysis table showing how a 10% drop in net profit per order changes the whole monthly result is a good reminder that these numbers aren’t static month to month
-
if anyone wants an actual community discussion around this exact topic, there’s a solid thread on sellviaexperience called “the real break-even math before you start” that goes into similar territory from a different angle
-
the processing capital section explaining that a profitable order can still create an immediate cash requirement finally explained why i felt broke during a week i was technically making money
-
yeah the four states (profitable, processed, available, withdrawn) framework is really useful for separating what’s actually happening at each stage
-
-
common mistake #4 about treating risk reserve as either fully available or permanently gone described my exact confusion in month one
-
the spreadsheet framework section is genuinely something i’m going to copy into my own tracking sheet this week
-
appreciate that this doesn’t pretend there’s one universal revenue target. two stores with identical revenue really can have completely different outcomes depending on cac and net profit per order
-
this matches almost exactly what someone described in a longer format on sellviaexperience.com, there’s a post there about their real 6 month experience running a digital store that walks through similar monthly progression
-
the point about scaling advertising before contribution margin is positive just multiplying the loss faster is something i wish i’d understood before increasing my budget in week 3
-
using clicks instead of acquired customers to calculate cac was exactly my mistake early on. cost per click told me nothing about whether the traffic was actually worth paying for
-
same thing happened to me, scaled right when my unit economics were still negative and just accelerated how fast i was losing money
-
the four scenarios comparison table is more useful than most entire articles about sellvia profitability. actually shows the math instead of just claiming a result
-
worth pairing this with the sellvia payments withdrawals thread on sellvia.reviews if anyone’s still confused about how the money actually moves after it’s earned, filled in some gaps this article touches on more briefly
-
the point about not counting pending and incoming as spendable profit is something every new store owner learns the hard way at least once
-
genuinely the most rigorous piece of sellvia content i’ve read, bookmarking this for whenever i need to explain break-even math to someone else considering the platform
-
[…] decreased contribution after ads. Full documentation of both the Sellvia pricing structure and the Sellvia break-even analysis is available on dedicated pages; this page does not repeat that explanatory content and instead […]
-
When someone asks what I tell people, the honest answer is: the break-even math only made sense once I stopped mixing dashboard revenue with what actually hit my Available balance – those are two completely different numbers. I used to be the person talking others out of platforms like this, and now I’m the one explaining why the $39 a month is worth tracking properly against your actual processed-order profit, not the gross figure. (The $100 withdrawal minimum is also something I wish someone had mentioned upfront – would have saved me some early confusion.)
-
The part of this breakdown that actually matched my experience was the SEO package reducing how hard the ad budget had to work – once that kicked in, the $10 daily ad spend felt less like a drain and more like a backup.
-
The thing this piece finally names clearly is that the dashboard order total and actual recovered cash are two completely different numbers – I kept confusing them through my whole first month until I mapped the $39 subscription and ad spend against what had actually cleared. Once I started treating contribution margin and total period profit as separate questions (like this article explains), the math stopped feeling like a moving target.
-
The deposit mechanic for auto-processing was the thing that shifted my thinking – once I had enough in Available commission to clear the $100 withdrawal minimum, the whole balance workflow finally made sense as a system rather than a delay. Before that point I kept confusing Incoming commission with money I could actually use, which made my break-even math look worse than it was. Separate those two columns and the numbers get a lot more honest.
-
The cost nobody prepared me for was the gap between “commission earned” and “commission available” – the system has real validation stages, and if you’re budgeting around what the dashboard shows rather than what’s cleared, your break-even math will be wrong before you even start. I kept telling myself to wait a bit longer before drawing conclusions, and honestly that patience was the only thing that kept my numbers accurate.
-
The break-even framing here is solid, but the piece I kept getting wrong early on was treating Growth Manager check-ins as just noise – turns out those nudges were the thing that actually steered my ad spend toward products with real margin before I burned through my budget. Once I stopped second-guessing the process and just let the commission stages clear naturally, the $39 monthly cost stopped feeling like a drag and started looking like the cheapest line item on the sheet.
-
The one thing I wish someone had spelled out before I started is that processed-order commission and available-to-withdraw commission are not the same number, and that gap threw off my break-even math for longer than I’d like to admit. What actually helped was treating the $39 subscription as a fixed floor and working backward from there – once processed profit cleared that line consistently, everything else started making sense. Pending totals look great on the dashboard but they are not cash, and the setup does not pretend otherwise once you know where to look.
-
The break-even math clicked for me when I stopped treating the SEO tools as a bonus and started counting them as a real offset against the $10 daily ad spend – well, not exactly offset but close enough that my paid ad dependency dropped noticeably. Once organic traffic started picking up through the setup, the whole calculation shifted in a way the dashboard alone never showed me.



Erick Borth is an ecommerce writer and digital platform researcher at Sellvia.biz. He covers Sellvia’s business tools, subscription options, built-in advertising features, order processing, analytics, and financial workflows. Erick focuses on presenting platform information in a clear and practical way, helping beginners understand how Sellvia operates, identify the costs involved, evaluate its features, and make informed decisions about starting and managing an online business.
Leave a Reply