
Sellvia financial operations
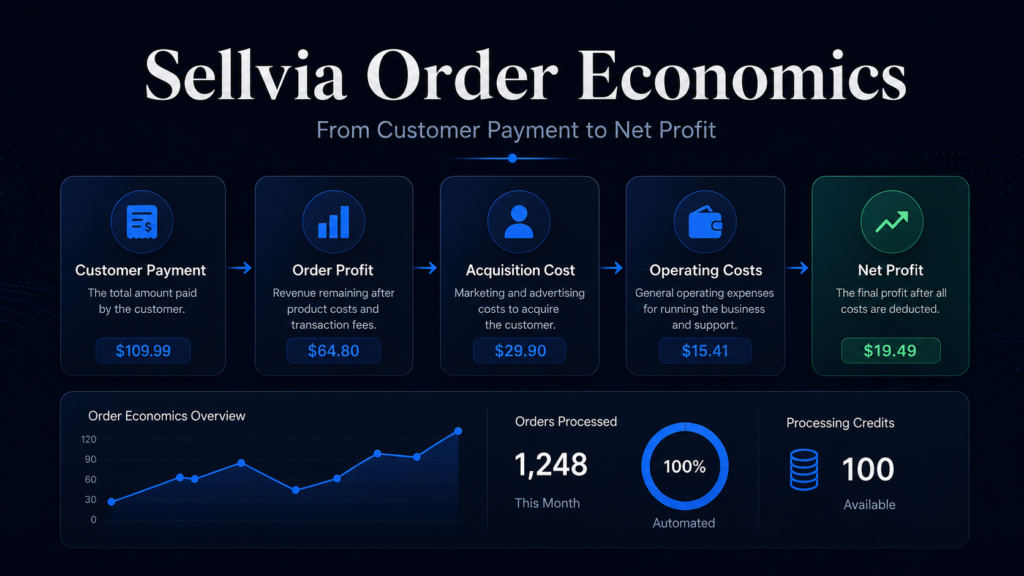
Sellvia Order Economics: What Customer Payment, Order Profit and Net Profit Actually Mean
A Sellvia order can show a customer-facing price, a platform Commission figure, a processing requirement and a positive “profit” number at the same time. Those figures describe different parts of the economics. The useful business question is not which number is the biggest. It is which costs have already been reflected, which still belong to the order, and what remains after acquisition and recurring operating expenses are assigned to the same period.
Quick answer: Under Sellvia’s current Terms, an end-customer payment on a Sellvia Ecosystem Order is received and retained by Sellvia as merchant of record; it is not money held for the store operator. Separately, Sellvia may allocate Commission from its own corporate funds. To estimate real order economics, start with the verified order-level earnings shown for the order, add any direct charge that is not already reflected, then subtract attributable customer-acquisition cost and the order’s share of recurring operating expenses. That gives a managerial contribution figure, not an immediate cash-withdrawal amount.
Research basis. This article was checked against Sellvia’s Terms of Use, last updated August 2026, plus the current Help Center pages for Dashboard fees, Order Processing Credits and balances and payouts. Where the Help Center and August 2026 Terms use different labels or rates, this article uses the Terms for the core model and tells the reader to confirm the rate shown for the actual order in the Dashboard.
In this guide
- One order creates two financial stories
- Why customer payment is not automatically your revenue
- How to build a Sellvia order P&L
- Direct order costs under the current Terms
- Why approval method changes unit economics
- Worked example: one order from dashboard earnings to operating contribution
- Incremental contribution vs fully loaded profitability
- How to allocate subscription and Performance Tier costs
- Why profit and Available cash are different
- Five numbers I would track every reporting period
- Common order-economics mistakes
- The number that matters after the order
- FAQ
One Sellvia Order Creates Two Financial Stories
The cleanest way I have found to read a Sellvia order is to stop forcing every number into one “sales minus costs” waterfall. The current Terms make that model too simplistic.
For a Sellvia Ecosystem Order, the first financial story is the customer-side transaction. The end customer pays Sellvia. Sellvia describes itself as the seller and merchant of record for that transaction and states that it retains the entire customer payment. The store operator does not receive that payment on Sellvia’s behalf and does not acquire a claim to it.
The second financial story is the partner-side economics. Sellvia may associate Commission with an attributed order under its Partnership Program. The Terms define that Commission as a Sellvia-funded promotional incentive, not as customer money or sales revenue. The operator can also have separate obligations to pay order-related platform fees and other services from their own funds.
That distinction looks legalistic at first. Economically, it solves one of the biggest sources of confusion in Sellvia analysis: a customer-facing order amount, the Commission attached to an order, the amount you must pay to approve that order, and the cash eventually eligible for redemption are not four versions of the same pool of money.
This is also why a transaction can make business sense even when the amount shown to the customer never lands in the operator’s bank account. The question for the operator is whether Sellvia-funded order earnings, after all applicable costs, create enough contribution to justify acquisition and recurring platform expense.
Why a Customer Payment Is Not Automatically Your Revenue
Generic ecommerce accounting usually begins with revenue. A customer pays $100, the business records $100 of gross revenue, and expenses are deducted from there. That mental model should not be imported into every Sellvia transaction without checking which order model applies.
The August 2026 Terms explicitly say that, for Sellvia Ecosystem Orders, the end customer pays Sellvia and Sellvia retains the payment. They also state that Commission is calculated by reference to Sellvia’s Catalog Retail Price framework rather than being a settlement of the end-customer payment. Commission is funded from Sellvia’s corporate operating funds and is subject to the Partnership Program rules.
For managerial analysis, I therefore treat the customer-facing amount as a transaction activity metric. It can be useful for understanding the scale of customer demand and the retail value attached to orders. I do not automatically place it at the top of the operator’s own profit-and-loss statement as if it were cash collected by the operator.
This distinction becomes especially important when comparing the Sellvia dashboard with a bank statement. A dashboard can show strong customer activity and positive Commission while the business still has cash tied up in order approval, advertising and recurring charges. That is not necessarily a contradiction. It is a consequence of looking at different financial layers.
A useful rule for reading the dashboard. Ask what each number is measuring before you subtract anything from it. Customer order value measures customer-side activity. Commission measures a Sellvia-funded incentive associated with eligible activity. A “Your profit” or order-level earnings figure may already reflect some direct order economics. Operating contribution adds acquisition and recurring-cost allocation. Available Commission measures eligibility for permitted use or redemption, not period profit.
There is a separate model in the Terms for a Customer Store Order where the operator connects their own independently operated payment system. In that case the end customer pays the operator directly, Sellvia does not handle those customer funds, and no Sellvia Commission arises for that order. That is economically different enough that it should be modeled separately. The rest of this article focuses on the Sellvia Ecosystem/Partner-side model in which Commission can be associated with an attributed order.
How to Build a Sellvia Order P&L Without Double Counting
The hardest part of Sellvia profit-per-order analysis is not arithmetic. It is deciding which expenses have already been reflected in the number you start with.
If an order record shows a verified order-level earnings or “Your profit” figure after the order has been processed, I use that as the starting point for managerial reconciliation. I then subtract only costs that are not already incorporated into that order-level figure.
This matters because paying money during order approval and recording an economic expense are related but not identical bookkeeping events. A card charge can create a working-capital requirement today even if the platform’s order-level profit figure already reflects the same order cost. Subtracting the charge again from that already-net figure would understate profitability.
Managerial order contribution
Verified order-level earnings
− attributable acquisition cost
− direct order charges not already reflected in the starting figure
− allocated recurring operating costs
The phrase “not already reflected” is the control that keeps the model honest. Before building a spreadsheet, compare the order receipt, approval confirmation and the figure shown for the processed order. If a $15 fee reduced the displayed order earnings, do not subtract the same $15 a second time. If the fee was charged separately and the dashboard number is gross of that fee, then it belongs in the reconciliation.
For the broader cost stack outside a single transaction, the dedicated Sellvia pricing and operating costs guide is the better reference. Here, the objective is narrower: turn one processed order into a defensible contribution figure.

Sellvia Order Economics Reconciliation
| Metric | What it represents | Order-level or period-level? | Should it be called profit? |
|---|---|---|---|
| Customer-facing order value | Retail activity associated with the transaction | Order-level | No. Under the current Ecosystem model, it is not automatically the operator’s sales revenue. |
| Applicable order service charge | A fee the operator owes Sellvia for the applicable order type | Order-level | No. It is a cost or cash requirement. |
| Approval-method fee | Additional charge based on individual, bulk or automatic approval | Order-level | No. |
| Commission / displayed order earnings | Sellvia-funded earnings associated with eligible attributed activity | Order-level | Useful as order earnings, but not automatically final net profit. |
| CAC per processed order | Acquisition spend attributable to obtaining that processed order | Order-level allocation | No. It reduces contribution. |
| Subscription allocation | The period subscription divided across the orders being analyzed | Period cost allocated to orders | No. |
| Performance Tier allocation | Optional weekly tier expense assigned to the same reporting period | Period cost allocated to orders | No. |
| Adjusted contribution | Order earnings after acquisition and allocated operating costs | Managerial order-level result | Yes, with a clear definition. It is not necessarily withdrawable cash. |
| Available Commission | Commission that has reached the Available state under current rules | Liquidity / balance state | No. It answers a cash-availability question. |
| Bank redemption | Cash that actually reaches an external account after eligibility and redemption costs | Cash-flow event | No. It is realized cash movement, not the period P&L by itself. |
Direct Costs That Belong to One Sellvia Order
The August 2026 Terms are more useful for order economics than many older fee summaries because they separate the order source from the approval method.
For an eligible digital-product order, the current Terms describe an Order Service Fee or CPA Service Fee of 10% to 18% of the Catalog Retail Price, depending on the order source. Only one of those two service-fee labels applies to a given order. For Promoted Orders, a separate CPA Fee can also apply according to the published CPA Rate for the applicable catalog item.
Then there is a second decision: how the order is approved. Individual approval has no additional approval-method fee under the current summary table. A bulk operation involving two or more orders adds 7% of Catalog Retail Price to each included order. Automatic approval adds 15%.
| Current Terms component | Rate / rule | Economic role |
|---|---|---|
| Order Service Fee / CPA Service Fee | 10%–18% of Catalog Retail Price | Core order-specific service charge; which label applies depends on order source. |
| Individual approval | 0% additional approval-method fee | Lowest documented approval-method surcharge, but requires manual action. |
| Accelerated bulk approval | 7% per included order | Additional cost for approving two or more orders in one bulk operation. |
| Automatic approval | 15% per automatically approved order | Convenience/automation cost, applied separately from the order service fee. |
| Late Approval Fee | 9% when Sellvia applies Available Commission under the documented late-approval process | Additional charge that can stack with the automatic approval fee and the applicable order service fee. |
Documentation note. Sellvia’s current Help Center fee page still uses some different terminology and ranges. It lists a 20% Referral Fee for completed orders processed through Sellvia Payments, a 9.99%–18% “Processing Fee,” a 15%–23% Auto-Processing Fee range and a 9%–18% Late Processing Charge range. The August 2026 Terms, however, define the order-level fee structure differently and state 10%–18% for the Order/CPA Service Fee, 7% for bulk approval, 15% for automatic approval and 9% for the Late Approval Fee.
For this article’s model, I use the August 2026 Terms as the contractual baseline. For a real order, the fee breakdown shown before approval or on the actual receipt is the final figure to use in your spreadsheet. I would not build a profit model by combining every percentage visible across different documentation pages.
This is a good example of why a fee list is not enough. The correct unit-economics calculation depends on order source, approval method, the rate shown for that order, and whether the displayed order earnings already account for some or all of those charges.
Why Approval Method Changes Unit Economics
Approval method is one of the few levers that can change the documented cost structure of an otherwise similar order. That makes it a real unit-economics decision, not just an interface preference.
Under the August 2026 Terms, approving an order individually adds no approval-method surcharge. Approving two or more orders together in a bulk operation adds 7%. Automatic approval adds 15%. The bulk and automatic approval fees are mutually exclusive for the same order.
That does not mean “manual is always better.” Automation has operational value. If orders arrive while you are away from the dashboard, automatic approval can reduce the risk that orders remain unattended. The business question is whether that convenience is worth the incremental cost at your current order value and contribution margin.
|
Individual approval
Economically attractive when the operator can reliably review orders and wants to minimize the documented approval-method surcharge. |
Automatic approval
Economically attractive when the value of speed, reduced manual work and operational continuity exceeds the additional 15% approval-method charge for the affected order. |
Bulk approval sits between those two. At 7%, it has a lower documented surcharge than automatic approval while still reducing repetitive manual work. But it is not a free shortcut: the Terms state that the 7% is charged to each order included in the bulk operation.
Order Processing Credits introduce a second layer. The Help Center says credits are pre-funded and used for automatic processing, and currently states that a 28% service fee applies when topping them up. The August Terms also list a 28% fee when Available Commission is redeemed toward Order Processing Credits. Because these credits are about operational convenience and working capital, I track their funding cost separately from the order’s acquisition cost.
The practical takeaway is simple: if approval method changes, rerun the unit economics. Do not assume the same “profit per order” survives an automatic-processing switch unchanged.

Worked Example: From One Processed Order to Operating Contribution
The example below is deliberately illustrative. It is not an earnings claim and it is not intended to reproduce a specific account. Its purpose is to show how I would reconcile an order once the actual dashboard and receipt figures are known.
Assume the operator has a digital-product order with a Catalog Retail Price of $100. The order is approved individually. The receipt shows a 12% Order Service Fee, which falls inside the 10%–18% range defined by the current Terms, and there is no additional approval-method surcharge for individual approval.
Now assume that after the required order workflow, the dashboard displays $52 of verified order-level earnings associated with the order. For this example, we will treat that $52 as the starting order-earnings figure and assume the dashboard/order record already reflects the direct order economics that should be reflected there. Therefore, the $12 approval payment is tracked as a working-capital event but is not deducted again from the $52.
During the same reporting period, the business generated 30 processed orders. Total acquisition spend attributable to those orders was $540, so CAC per processed order is $18. The active base subscription is $39 per month, producing a managerial allocation of $1.30 per processed order. The account uses the free Basic Performance Tier in this example. Another $60 of recurring tools are assigned to the same 30-order period, or $2 per processed order.
| Economic layer | Amount | How to read it |
|---|---|---|
| Catalog Retail Price / customer-side reference | $100.00 | Reference value for the item/order. It is not treated here as operator-owned customer revenue. |
| Order Service Fee shown for approval | $12.00 | Direct platform charge paid from operator funds. In this example it is already reflected in the starting order-earnings view, so it is not deducted twice. |
| Individual approval surcharge | $0.00 | No additional approval-method fee under the current Terms. |
| Verified order-level earnings / Commission starting point | $52.00 | Illustrative order earnings shown after processing. This is the P&L starting point, not the customer payment. |
| Allocated CAC | −$18.00 | $540 acquisition spend ÷ 30 processed orders. |
| Base subscription allocation | −$1.30 | $39 monthly subscription ÷ 30 processed orders. |
| Performance Tier allocation | $0.00 | Basic free tier used for the illustration. |
| Other recurring-cost allocation | −$2.00 | $60 of other period operating cost ÷ 30 processed orders. |
| Fully loaded managerial contribution | $30.70 | Order-level earnings after acquisition and allocated recurring costs, using the assumptions above. |
Illustrative fully loaded contribution
$52.00 − $18.00 − $1.30 − $2.00 = $30.70
The $30.70 figure is much more useful for management than simply saying the order was “$100 in sales” or “$52 profit.” It answers a narrower question: after the order-level earnings shown by the platform, acquisition cost and a consistent allocation of period expenses, how much did this order contribute to the analyzed period?
It still does not tell us how much can be redeemed today. Liquidity is a separate question.
What if the order were automatically approved?
Under the documented August 2026 structure, automatic approval adds 15% of Catalog Retail Price. On a $100 reference value, that would be a $15 additional approval-method charge. But I would not simply take the $30.70 above and subtract $15 without checking the actual order record.
If the dashboard’s verified $52 starting figure would already be lower because of the automatic-approval charge, subtracting $15 again would be double counting. If the $52 is gross of that fee, then the $15 belongs below it in the reconciliation. This is exactly why the receipt and final order-level earnings figure matter more than a generic calculator.
What if two or more orders are approved in bulk?
The Terms set the Accelerated Bulk Processing Fee at 7% for each order included in a single bulk operation involving at least two orders. A $100 reference value would therefore produce a $7 additional approval-method charge per included order. Again, use the actual order record to determine whether that cost has already reduced the earnings figure you are using as your starting point.
The worked example demonstrates a broader principle: good Sellvia unit economics are built from verified transaction data first and formulas second. A formula is only as good as the classification of the numbers being fed into it.
Incremental Contribution and Fully Loaded Profitability Answer Different Questions
Once the direct order mechanics are clear, I find it useful to calculate two profit views rather than forcing everything into one number.
Incremental contribution
Incremental contribution asks:
If I generate one more similar processed order under the same operating setup, does that additional order add economic value?
The starting point is verified order-level earnings. Then subtract the costs that rise because the additional order exists, especially attributable acquisition cost and any direct charge that is not already reflected in the order figure.
Incremental contribution
Verified order-level earnings − incremental acquisition cost − unreflected variable order costs
This is the better lens for short-term scaling decisions. If another $18 of acquisition spend consistently produces an order that contributes substantially more than $18 after direct economics, the incremental economics can be positive even before the full monthly business has covered every fixed expense.
Fully loaded profitability
Fully loaded profitability asks a different question:
Did the orders generated during this reporting period pay for the complete operating structure assigned to the same period?
That is where the monthly subscription, paid Performance Tier, recurring tools and other period costs enter the model.
Fully loaded order contribution
Incremental contribution − allocated subscription − allocated tier cost − allocated recurring operating costs
A business can therefore have positive incremental contribution and still show a negative fully loaded monthly result when order volume is low. That is normal unit economics. Fixed costs are being spread across too few completed orders.
If you want to move from this one-order view to the exact volume required to cover the entire period, use the separate Sellvia break-even analysis. It is designed for the threshold question; this article is designed for the transaction-reconciliation question.
Fixed Costs Do Not Disappear Because They Are Missing From the Order Screen
The dashboard can be perfectly correct at the order level and still not answer whether the whole business made money that month. Subscription and recurring operating charges live at a different accounting level.
The August 2026 Terms currently list Sellvia PRO at $39 per month for Basic, $99 per month for Advanced and $299 per month for Ultimate. The same Terms list optional Performance Tiers separately: Basic free, Plus $19 per week, Advanced $39 per week, Pro $69 per week and Elite $99 per week.
I would not hard-code historical order limits into an economics model. The current Terms explicitly say that Performance Tier thresholds, tool availability and feature scope can vary and may be updated. For cost allocation, the number that matters is the actual tier charge incurred during the reporting period.
A simple managerial allocation
If a $39 subscription supports 30 processed orders in a month, the simplest allocation is $1.30 per processed order. If it supports 100 processed orders, the same fixed subscription allocates to $0.39 per order.
That does not mean accounting standards require you to expense the subscription on a per-order basis. This is a managerial tool for comparing economics consistently.
| Processed orders in period | $39 subscription allocation per order | What changes? |
|---|---|---|
| 10 | $3.90 | Low volume makes the fixed subscription more visible in unit economics. |
| 30 | $1.30 | Worked-example assumption. |
| 50 | $0.78 | Same fixed expense spread across more processed orders. |
| 100 | $0.39 | Fixed-cost drag per order becomes relatively small. |
The same method can be used for an optional Performance Tier. If the business pays a $19 weekly Plus Tier throughout a four-week analytical period, the managerial period cost is $76 before considering any other recurring tools. Divide that by processed orders only if a per-order allocation helps the decision you are making.
The important part is consistency. Use the same date range for order earnings, advertising, subscription charges and tier charges. Mixing a week of earnings with a month of fixed cost will produce a meaningless margin.
For a complete cost-stack view rather than this allocation method, the separate Sellvia pricing guide goes deeper into the platform-wide expense structure.
Customer Acquisition Cost Belongs in Sellvia Profit per Order
Acquisition is where a positive dashboard order can turn into either a strong business contribution or a weak one.
If Sellvia or another channel generates 30 processed orders from $540 of attributable campaign spend, the acquisition cost per processed order is $18. Using cost per processed order is usually more informative than cost per click or cost per lead when the objective is order economics, because it matches the denominator used for the earnings side of the calculation.
CAC per processed order
Attributable acquisition spend ÷ processed orders from that spend
I prefer to keep advertising funding events separate from advertising expense. Moving $500 into an Ads Credits balance is a cash-allocation event. The actual period acquisition expense is the amount consumed by campaigns during the reporting window, plus any applicable advertising-service charge that has not already been incorporated into the balance/expense figure you use.
The current Help Center states that Sellvia Ads has a 28% Advertising Fee when daily advertising payments are charged from the Ads balance. When I model a campaign, I therefore use the actual all-in amount consumed by the service rather than looking only at the media-budget headline.
That keeps the comparison fair. An order with $52 of verified order-level earnings and $18 CAC is economically different from the same order with $40 CAC, even though the order screen itself may look identical.
Profit Is Not the Same as Available Cash
This article deliberately stops short of re-explaining the full Pending, Incoming, Available and validation workflow because that is already covered in the dedicated Sellvia cash flow guide.
For order economics, the essential point is that an economically positive order does not imply immediately usable cash.
Sellvia’s August 2026 Terms describe Commission states including Pending, Incoming and Available. Incoming can remain in verification for up to 72 hours. The Terms also now state that the duration of a later Validation Window and the applicable allocation percentage are determined by Sellvia and can be modified based on the account and risk context.
This is worth highlighting because the current Help Center still describes a more specific 75% Available / 25% Risk Reserve split with a 125-day reserve period. Rather than treating that Help Center explanation as a permanent universal constant, I would use the balance state actually displayed in the account and the Terms that apply at the time of the transaction.
The same caution applies to payout thresholds. The August 2026 Terms currently say the minimum Available Commission redemption amount is $100 for U.S. residents and $300 for residents of other countries, while the Help Center still contains $100 general-language references and method-specific minimums. That is another reason not to mix payout mechanics into the order P&L.
The Five Numbers I Would Track for Every Sellvia Reporting Period
After reconciling individual orders, I would reduce the operating dashboard to five management numbers. These are not the only metrics worth keeping, but together they tell me whether the economics are improving or merely getting busier.
1. Processed order count
I use processed orders rather than raw order attempts as the basic denominator for unit economics. It keeps CAC, recurring-cost allocation and verified order earnings tied to transactions that actually entered the completed processing workflow.
2. Average verified order-level earnings
This is the order-side earnings figure I can reconcile to actual processed-order records. I prefer a verified average over a theoretical margin because product mix, order source and approval method can change the economics from one order to the next.
3. Acquisition cost per processed order
This is where marketing efficiency becomes comparable with order earnings. If acquisition cost rises faster than verified order earnings, contribution compresses even when order volume rises.
4. Recurring operating cost per processed order
I combine the base subscription, paid Performance Tier and other recurring tools for the period, then divide by processed orders when I want a fully loaded unit view. The number should decline as order volume grows unless recurring service spend grows even faster.
5. External cash required for the next processing cycle
This is the liquidity number I would never infer from profit alone. Even a positive operating model can be constrained if new order approvals and campaigns require cash before sufficient Commission becomes Available for permitted use or redemption.
Once these five values are known, scenario modeling becomes much easier. For larger volume and sensitivity analysis, the Sellvia economics benchmark is designed to test how order count, acquisition spend and cost assumptions interact across multiple cases.
Common Mistakes That Make Sellvia Net Profit Look Better or Worse Than It Is
Calling the customer payment your own revenue without checking the order model
For the current Sellvia Ecosystem model, that is inconsistent with the Terms. Start with the operator-side Commission/order-earnings layer for profitability analysis.
Subtracting processing-related cash twice
This is the mistake I watch for most closely when a dashboard already displays a post-processing order earnings figure. If an expense is already reflected in that figure, recording the card payment again as a second P&L deduction will artificially depress profit. Keep a separate working-capital ledger so cash timing does not contaminate the income calculation.
Using every fee percentage found online at the same time
Sellvia’s documentation has changed and its Help Center currently contains labels and ranges that do not map perfectly to the August 2026 Terms. Build the model from the specific order type, the actual approval method and the fee breakdown shown for the order. Do not stack the Help Center’s 20% Referral Fee, a 19% Standard Service Fee, a 10%–18% Order Service Fee and every other percentage unless the actual transaction documents show that combination.
Ignoring the approval method
Individual, bulk and automatic approval do not have the same documented additional fee. A margin model that assumes manual economics while operations use automatic approval can materially overstate contribution.
Using clicks or leads as the denominator for recurring costs
Subscription and tier costs support the operating system, not individual clicks. For a profit-per-order view, allocate them across processed orders in the same reporting period.
Mixing cash transfers with expenses
Funding a credits balance changes where cash sits. An expense occurs when the service is consumed or when an applicable fee is actually charged. Treating every balance transfer as immediate operating expense can make the P&L noisy and hard to reconcile.
Assuming a positive order contribution guarantees a positive month
Ten good orders may not cover a month of fixed operating costs. That is why incremental and fully loaded profitability should be shown side by side.
How I Would Audit a Real Sellvia Order in Five Minutes
When I review an actual order, I do not start by looking for a universal Sellvia profit formula. I start with the order record and work outward.
- Identify the order source and applicable product/order type. That tells me which current Terms category should govern the direct service fee.
- Record the Catalog Retail Price and approval method. I note whether approval was individual, bulk or automatic.
- Save the actual fee breakdown or receipt. This matters more than a generic percentage range because Sellvia states that the rate applicable to an order is the rate in effect when the order is created.
- Record the verified order-level earnings shown after processing. I treat that as the operator-side starting point and determine which direct fees it already reflects.
- Add period economics. I assign CAC and a consistent share of subscription, tier and recurring costs, then keep Available Commission and bank redemption in a separate cash-flow column.
This process turns the dashboard into something closer to a transaction ledger. It also makes disagreements between pages easier to diagnose: instead of asking which generic Sellvia fee article is correct, you can compare the current Terms with the exact charge shown for the actual order.
The Number That Matters After a Sellvia Order
The most useful Sellvia profit number is not the customer-facing payment, and it is not necessarily the largest “profit” label visible on a dashboard card.
For management, I want the fully loaded contribution of the processed order: verified order-level earnings, minus acquisition and any direct charge not already reflected, minus a consistent allocation of recurring operating costs.
That number tells me whether the activity is building economic value. The cash-flow ledger then tells me whether the business has enough liquidity to keep processing new orders and how much Commission has become eligible for permitted use or redemption.
This separation is one of Sellvia’s advantages once the dashboard is read correctly. The platform exposes enough order, fee, Commission and balance information to build a practical reconciliation rather than relying on a vague percentage-margin estimate. The analytical work is to classify each number correctly and avoid mixing customer-side transaction value, operator-side Commission, operating profit and cash availability.
If you want to test your own assumptions, use the Sellvia Profit Calculator with your actual processed-order count, verified order earnings, advertising spend, active subscription, tier charge and other operating costs. For the wider platform context behind those calculations, see the full Sellvia business analysis.
Practical takeaway. A Sellvia order becomes economically useful when you can reconcile what the order earned for the operator, what it cost to acquire, which order-level charges are already reflected, which recurring costs belong to the period, and what cash is actually available. Once those layers are separated, “Sellvia profit per order” becomes a measurable operating metric rather than a guess based on customer sales totals.
FAQ
Is the profit shown on a Sellvia order my final net profit?
Not necessarily. An order-level earnings or “Your profit” figure can be a useful starting point, but complete operating profit also depends on customer-acquisition cost, recurring subscription expense, any paid Performance Tier, other period costs and any direct charge that is not already reflected in the displayed order figure.
Does the customer payment become revenue for the Sellvia store operator?
For a Sellvia Ecosystem Order under the August 2026 Terms, no. The end customer pays Sellvia, Sellvia acts as merchant of record and retains the payment. Commission allocated to the operator is described separately as a Sellvia-funded promotional incentive. A Customer Store Order using the operator’s own payment system follows a different model.
How do I calculate real Sellvia profit per order?
Start with verified order-level earnings, subtract attributable acquisition cost, subtract any direct order cost not already reflected in that starting figure, and allocate the relevant share of subscription, tier and other recurring operating costs. Keep cash availability and payout timing in a separate cash-flow view.
Should advertising be included in Sellvia order profit?
Yes when you are calculating business contribution rather than merely reading the platform’s order-level earnings. Use acquisition spend attributable to the processed orders in the same reporting period. Cost per processed order is usually the cleanest denominator for this purpose.
Does the Sellvia subscription affect profit per order?
Yes at the fully loaded managerial level. The subscription is a period cost rather than a charge caused by one specific order, so it can be allocated across processed orders to understand how much fixed operating cost each order must support.
Why can an order be profitable while cash is still unavailable?
Profitability and liquidity answer different questions. A processed order can have positive economic contribution while Commission is still moving through Sellvia’s documented balance and validation stages. The amount eligible for permitted use or redemption can therefore lag the P&L result.
Which number should I use when deciding whether to scale?
Use incremental contribution for the immediate decision: verified order-level earnings minus the acquisition and variable costs caused by another order. Then check fully loaded period profitability and working-capital capacity before scaling aggressively. Positive incremental contribution is important, but the business also needs to cover recurring costs and keep enough liquidity for the next operating cycle.
Primary source note: Sellvia Terms of Use, last updated August 2026; Sellvia Help Center pages “Sellvia Dashboard | Fees,” “How Order Processing Credits work,” and “Sellvia Dashboard | Balance and Payouts.” Platform fees, thresholds, Commission rules and service descriptions can change. For a real transaction, verify the rate and fee breakdown displayed in the Sellvia Dashboard for that order before relying on any model.
6 responses to “Sellvia Order Economics: From Customer Payment to Net Profit”
-
the distinction between customer payment and operator commission finally explained why my dashboard numbers never matched what i intuitively expected as “my revenue”
-
the warning about not subtracting a fee twice when it’s already reflected in the displayed order earnings caught an actual mistake i didn’t know i was making in my own tracking
-
appreciate that this separates incremental contribution from fully loaded profitability, i was mashing those into one number and drawing the wrong conclusions about scaling
-
Ngl the part about ad economics is where this actually clicked for me – I put $10 a day through the built-in system and the $40 coupon meant I was running real campaigns before I’d even decided whether to keep the subscription.
-
the point about automatic approval adding 15% while bulk adds 7% for the exact same order type is something i wish i’d understood before turning on auto-processing without checking
-
the five numbers to track section is genuinely more useful than most spreadsheet templates i’ve tried building myself from scratch



Erick Borth is an ecommerce writer and digital platform researcher at Sellvia.biz. He covers Sellvia’s business tools, subscription options, built-in advertising features, order processing, analytics, and financial workflows. Erick focuses on presenting platform information in a clear and practical way, helping beginners understand how Sellvia operates, identify the costs involved, evaluate its features, and make informed decisions about starting and managing an online business.
Leave a Reply