
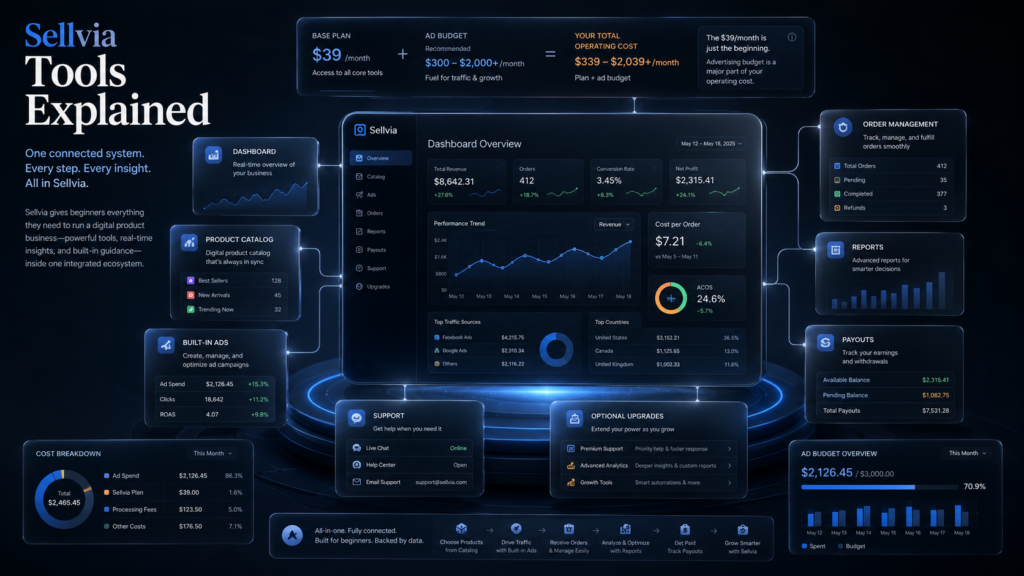
Search for Sellvia and you will quickly run into two numbers: $39 a month, and a lot of general talk about “beginner-friendly tools.” Neither number tells you much on its own. A $39 subscription is not the real operating cost, and “beginner-friendly” does not explain what actually happens when a customer places an order, or how long money takes to become withdrawable.
This guide breaks down the actual Sellvia toolset in specific terms: what each tool does, what it costs, what decision it helps a beginner make, and how the pieces connect into one working budget. Every number below is an example for planning purposes, not a guaranteed outcome, and current terms should always be confirmed directly on the platform.
The goal here is not to talk you into or out of using Sellvia. It is to replace vague impressions with the kind of specific math a beginner actually needs before committing money: what a full month of advertising really costs at different budget levels, how a $40 coupon compares to that cost, what happens between a sale and a withdrawable payout, and how to tell whether a campaign is on track toward break-even rather than just generating orders.
Quick Answer
Sellvia’s toolset includes a dashboard, a digital product catalog, a ready-made store, a built-in advertising system, order management, a reporting area, a payout and balance section, support access, and optional upgrades. The $39/month subscription only covers platform access. Advertising is a separate cost, typically $10 to $50 per day, which means a realistic first-month budget is closer to $339 to $1,539 depending on ad spend, before processing costs. Reports and order math matter more than the subscription price, because they determine whether ad spend is actually converting into profitable orders or simply generating activity. The numbers throughout this guide are examples; readers should confirm current pricing, margins, and catalog details directly with Sellvia.
Looking for the main overview first? Start with our Sellvia guide for pricing, tools, reviews, costs, and how the platform works.
Key Takeaways
- Sellvia tools are useful because they connect the store, products, ads, orders, reports, and payouts inside one platform.
- The $39/month subscription is only the base platform cost, not the full monthly operating budget.
- Built-in ads are usually the largest ongoing expense, with common budget levels ranging from $10 to $50 per day.
- A $40 advertising coupon may help with initial testing, but it does not cover a full month of advertising.
- Beginners should track cost per order, processing costs, net commission, pending balance, available balance, and break-even progress.
- Sellvia tools can reduce setup complexity, but they do not guarantee sales or profit.
What Are Sellvia Tools?

“Sellvia tools” is not a marketing phrase for a handful of extra features. It refers to the operating layer of the platform, the set of connected systems a user actually works inside once they sign up. That layer includes:
- A dashboard for daily monitoring
- A digital product catalog
- A ready-made store structure
- A built-in advertising system
- Order management
- A reporting area
- A balance and payout section
- Support access
- Optional upgrades
The distinction matters because a beginner is not evaluating one feature in isolation. They are evaluating whether nine connected systems, each with its own cost or decision point, add up to a workable business. That is the actual question this guide answers, section by section.
Sellvia Tools by Business Function
Before going tool by tool in detail, it helps to see the whole toolset side by side. The table below breaks down each Sellvia tool by what it does, how it affects cost, the main risk a beginner should watch for, and what to actually track.
| Sellvia tool | What it does | Cost impact | Main beginner risk | What to track |
|---|---|---|---|---|
| Dashboard | Central view of orders, ads, balance, and notifications | No direct cost | Checking it too rarely to catch problems early | Daily orders, ad status, balance changes |
| Digital product catalog | Provides ready-made digital products to add to the store | No direct cost for base catalog access | Choosing products randomly without a niche fit | Which products actually generate orders |
| Ready-made store | Gives a working storefront, checkout, and delivery setup | Included in the $39/month subscription | Assuming the store alone will attract traffic | Store presentation and conversion rate |
| Built-in ads | Sends paid traffic to the store | High; usually the largest ongoing expense | Spending without knowing cost per order | Daily spend, cost per order, order volume |
| Order management | Handles processing of each sale | Variable; processing costs apply per order | Treating a sale as instant profit | Processing costs, orders pending vs completed |
| Reports | Aggregates spend, orders, and earnings over time | No direct cost | Reacting to single days instead of trends | Break-even gap, weekly patterns |
| Payout tools | Manages pending and available balance and withdrawals | Timing impact; available balance can lag behind spend | Running out of working capital while waiting for payout | Pending balance, available balance, payout timing |
| Support | Answers platform and account questions | No direct cost | Expecting support to replace business judgment | Whether questions are platform issues or strategy issues |
| Optional upgrades | Adds product packs, design, or marketing add-ons | Additional cost only if purchased | Buying upgrades without a data-based reason | Whether an upgrade addresses a specific bottleneck |
Read as a whole, this table makes one pattern obvious: built-in ads and order management carry the most direct financial risk, while the dashboard and reports carry the most informational value. A beginner who only pays attention to the store and the catalog, while ignoring reports and payout timing, is missing the two tools most responsible for whether the business actually becomes profitable.
Sellvia Dashboard: What to Check Every Day
The dashboard is the single screen where all activity converges: orders, advertising status, spend, balance, and notifications. Treating it as a once-a-week check is a common early mistake, because ad spend and order flow can both change daily.
A practical daily routine looks like this:
- Morning: Check new orders, check the pending and available balance, and confirm advertising is active and running as expected.
- Midday: Compare spend against orders so far, and check whether daily ad spend is moving faster than expected relative to the daily budget.
- End of day: Record total ad spend, total orders, an estimated net commission figure, and any processing costs, even if some of these are rough estimates.
This routine takes a few minutes and produces exactly the data needed for the break-even calculations covered later in this guide. Skipping it for several days in a row is how beginners lose track of whether a campaign is working.
The dashboard also becomes most useful in specific situations that call for a decision rather than just observation:
- Spend is rising but orders are zero. This usually points to a targeting, product, or store presentation issue rather than a budget issue. Increasing spend further will not fix a conversion problem.
- Orders are coming in but the net result is negative. This means cost per order is outpacing net commission. The fix is almost never more ad spend; it is usually a product, price point, or targeting adjustment.
- Balance is growing but still mostly pending. This is a cash-flow signal, not a profitability signal. It means orders are happening, but the money is not yet usable to fund further advertising.
- Payout is delayed. This is the moment to pause and check the current payout rules directly on the platform rather than assuming a fixed schedule, since minimum thresholds and timing can change.
Dashboard Signals Beginners Should Not Ignore
Beyond the daily routine, a handful of recurring patterns in the dashboard are worth flagging early rather than noticing weeks later in a report. These are quick, at-a-glance signals rather than a full analysis:
- Ad spend rising noticeably faster than order count over several days in a row.
- Pending balance climbing while available balance stays flat.
- The same one or two products generating most orders, while the rest of the catalog produces little or nothing.
- Several consecutive days with real ad spend but zero orders.
- Orders steadily increasing while the estimated net result for the same period keeps coming out negative.
None of these signals on their own means something is broken. They are simply the kind of pattern that is easy to miss if the dashboard is only checked casually, and each one points toward a specific question worth answering: is the product working, is the ad targeting working, or is cash flow the actual constraint.
Sellvia Digital Product Catalog
The catalog is built around digital products such as guides, templates, checklists, courses, digital tools, and other educational or downloadable resources. Sellvia’s own materials have referenced a catalog with more than 60 products across roughly 8 categories, an average product value near $32, a margin range often cited around 60-70%, and a total catalog value above $2,000. These figures should be treated as a general sense of scale rather than fixed facts, since catalogs, pricing, and margin structures can change, and they should be verified directly inside the platform before being used for planning.
Selecting products is not something to do quickly. A product that fits the store well should have most of these characteristics:
- A clear, specific customer problem it solves
- An offer that is easy to understand from the product page alone
- A price point that feels reasonable for what is being offered
- A product page strong enough to convert visitors who arrive from ads
- A reasonable match with the kind of traffic the advertising system is likely to send
- Some consistency with the rest of the store’s category, rather than a random mix
- A price point that can be justified by the perceived value of the offer
The last point is worth expanding on. A $32 price point needs more perceived value behind it than a simple checklist can usually provide on its own, unless the offer is positioned clearly around a specific outcome. A basic checklist priced at $32 without context is a harder sell than a structured course or toolkit priced the same, because the buyer needs to see a reason the price matches the offer before they complete a purchase. Matching perceived value to price point is one of the most overlooked parts of product selection, and it affects conversion rate more than most beginners expect.
A store built around six unrelated product types is harder to advertise coherently than a store with a consistent theme, because the advertising system and the audience both respond better to a clear positioning.
Sellvia’s Ready-Made Store Tools
The store comes with a working structure already built: storefront layout, mobile display, product pages, checkout, and a delivery setup designed for digital products. This is worth comparing directly to a manual build, since the comparison is where the value of this tool becomes concrete.
Building an equivalent setup independently would typically require:
- A platform such as WordPress or Shopify
- A theme and basic design work
- Hosting and domain configuration
- A checkout and payment setup
- Product pages built from scratch
- A digital delivery method for files or access
- Analytics and ad tracking configuration
- A customer support workflow
Sellvia combines all of this into a single account. The user gains speed and avoids most of the technical setup, in exchange for less independent control over each individual piece and more reliance on Sellvia’s own rules and infrastructure.
Sellvia Built-In Advertising Tool: The Real Operating Cost
This is the section that most general overviews get wrong by underexplaining it, so it deserves the most detail. The built-in advertising system is Sellvia’s answer to the hardest problem most beginners face: getting traffic. It is meant to be activated with a chosen daily budget rather than requiring the user to build campaigns from scratch on outside ad platforms.
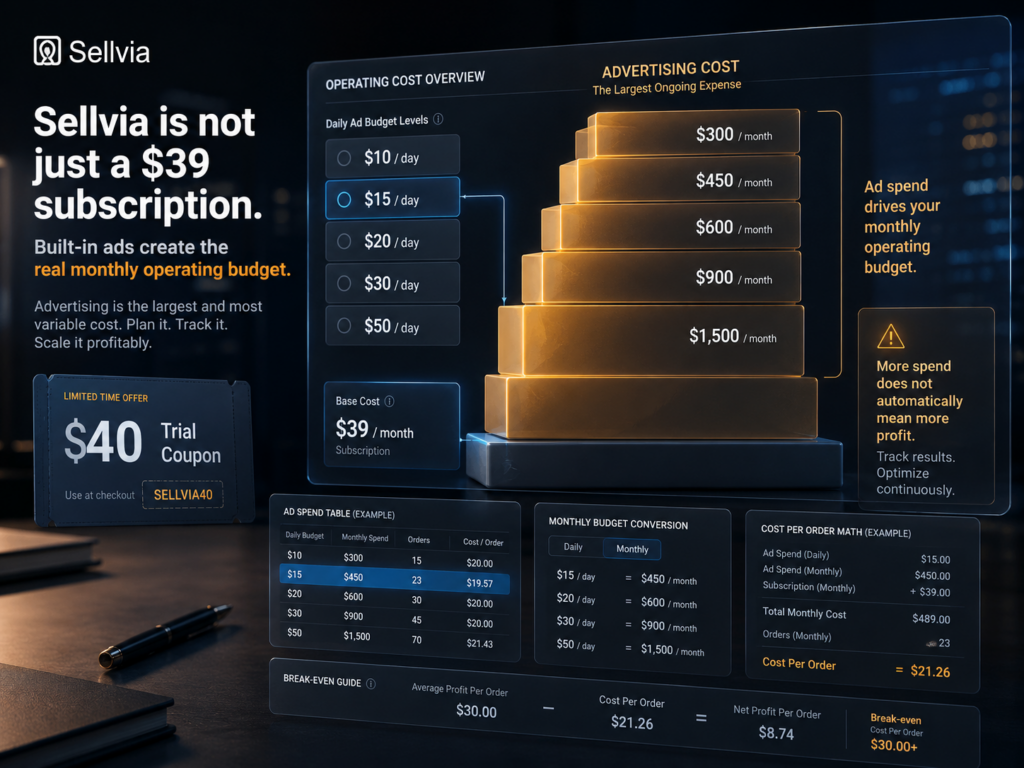
The first thing to understand clearly: advertising is not included in the $39/month subscription. It is a separate, ongoing cost, and it is usually the largest expense in the entire budget. Typical daily budget levels fall in this range:
- $10/day
- $15/day
- $20/day
- $30/day
- $50/day
New users may receive a $40 advertising coupon during the 14-day trial. This is useful for testing the system, but it is far from a full month of advertising. Here is exactly how long that $40 coupon actually lasts at each budget level:
| Ad budget | How long a $40 coupon lasts |
|---|---|
| $10/day | about 4 days |
| $15/day | about 2.6 days |
| $20/day | about 2 days |
| $30/day | about 1.3 days |
| $50/day | less than 1 day |
The practical takeaway is direct: even at the lowest common daily budget, the free coupon covers less than a week. A beginner who treats the $40 coupon as their entire marketing budget for the trial period will run out of ad spend almost immediately and see very little data as a result. Realistic testing usually requires the user to be ready to fund advertising beyond the coupon amount.
What a Full Month of Sellvia Advertising Actually Costs
Turning daily budgets into monthly numbers makes the real cost much clearer:
- $10/day = about $300/month
- $15/day = about $450/month
- $20/day = about $600/month
- $30/day = about $900/month
- $50/day = about $1,500/month
These figures are before the $39/month subscription and before any processing costs. Once the subscription is added, the picture looks like this:
Example Sellvia Monthly Budget Scenarios
| Daily ad budget | Approx. monthly ad spend | Base subscription | Estimated monthly budget before processing costs |
|---|---|---|---|
| $10/day | $300/month | $39/month | $339/month |
| $15/day | $450/month | $39/month | $489/month |
| $20/day | $600/month | $39/month | $639/month |
| $30/day | $900/month | $39/month | $939/month |
| $50/day | $1,500/month | $39/month | $1,539/month |
This table does not include order processing costs, optional upgrades, domain-related costs, or any other additional services. This is exactly why Sellvia should not be evaluated only by the $39/month subscription figure. The subscription is the entry fee to the platform, not the operating budget for the business itself.
A Realistic First-Month Sellvia Tools Scenario
Numbers become more useful when they are put together into a full first-month picture rather than viewed one at a time. Below are three illustrative scenarios, ranging from cautious to aggressive, built from the same kind of numbers used throughout this guide. These are examples to show how the math works, not guaranteed outcomes for any specific store.
Scenario A: Cautious Beginner
- Subscription: $39
- Ads: $10/day = $300/month
- Total before processing: $339
- Orders: 20
- Cost per order: $15
- Estimated net commission per order: $12
In this scenario, net commission per order ($12) is lower than cost per order ($15), which means the store is negative on a per-order basis before fixed costs are even fully recovered. Twenty orders at this ratio produce roughly $240 in net commission against $300 in ad spend alone, leaving the store short of the $339 total before processing costs are even factored in.
Scenario B: Improving Campaign
- Subscription: $39
- Ads: $10/day = $300/month
- Total before processing: $339
- Orders: 25
- Cost per order: $12
- Estimated net commission per order: $18
Here, net commission per order ($18) is clearly above cost per order ($12), which is a much more promising ratio. Twenty-five orders at this ratio produce roughly $450 in net commission against the same $300 in ad spend, which covers the $339 total before processing costs with room left over. The outcome still depends on actual processing costs and how quickly that commission becomes available through payout.
Scenario C: Aggressive Beginner
- Subscription: $39
- Ads: $30/day = $900/month
- Total before processing: $939
- Orders: 45
- Cost per order: $20
- Estimated net commission per order: $18
This scenario has the highest order count of the three, which might look like the strongest result at a glance. But net commission per order ($18) is still below cost per order ($20), so the unit economics are negative despite the higher volume. Forty-five orders at this ratio produce roughly $810 in net commission against $900 in ad spend, meaning the store is losing money on a larger scale than either of the first two scenarios. This is the clearest illustration in this guide of why scaling ad spend without first confirming a profitable cost-per-order ratio is risky rather than simply “more aggressive.”
Sellvia Order Management: What Happens Between a Sale and a Profit
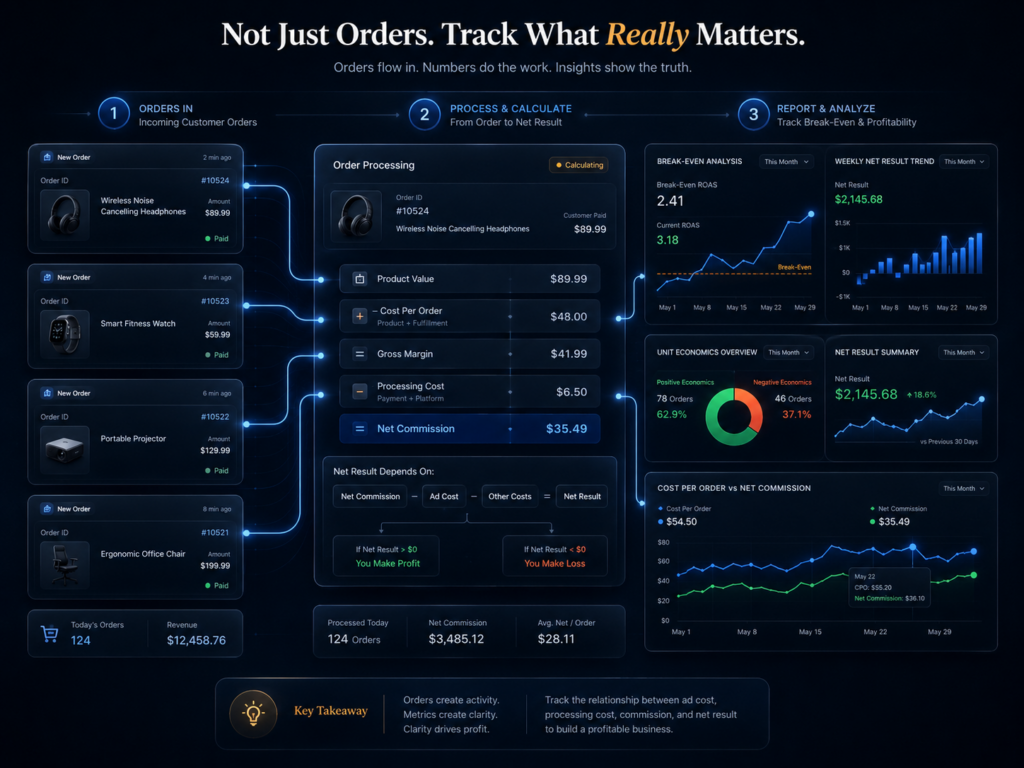
An order appearing in the dashboard is not the same as profit landing in an account. Here is the math worked through with concrete numbers, presented as an illustrative example rather than a guaranteed outcome.
Say a customer buys a digital product priced at $32, roughly the average product value referenced earlier. Sellvia’s margin materials often cite a range around 60-70%, but the actual net amount a store owner keeps depends on processing costs, current platform rules, and how much was spent on advertising to generate that specific order. Two contrasting examples show why this matters:
- Example A: Net commission after processing is $12. Advertising cost to generate that order was $15. Result: the order is negative by about $3.
- Example B: Net commission after processing is $20. Advertising cost to generate that order was $12. Result: the order leaves about $8 of room for profit.
The point is not that one number is “correct.” The point is that cost per order and net commission per order have to be compared directly, order by order or averaged across a batch, before anyone can say whether a campaign is actually working. A high order count with a bad ratio between these two numbers is not a success signal.
Sellvia Reports: Turning Activity Into a Business Decision
The reporting area is where all of the numbers above get compared against each other over time. At minimum, a beginner should be tracking:
- Daily ad spend
- Orders per day
- Cost per order
- Estimated net commission per order
- Total processing costs for the period
- Pending balance
- Available balance
- Progress toward the next payout
- The gap between total costs and total earnings, i.e. the break-even gap
A simple weekly tracking template makes this manageable without needing extra software:
| Week | Ad spend | Orders | Cost per order | Estimated net commission per order | Estimated result |
|---|---|---|---|---|---|
| Week 1 | $70 | 5 | $14 | $18 | +$20 before fixed costs |
| Week 2 | $100 | 6 | $16.67 | $15 | -$10 before fixed costs |
| Week 3 | $140 | 10 | $14 | $20 | +$60 before fixed costs |
| Week 4 | $180 | 12 | $15 | $18 | +$36 before fixed costs |
This example shows why week-to-week comparison matters more than any single day. Week 2 has more orders than Week 1, but a worse cost-per-order ratio, and it lands negative before fixed costs are even counted. Week 3 shows the same $14 cost per order as Week 1 but a stronger net commission, which produces the best result of the four weeks. Tracking this pattern over a full month, rather than reacting to one good or bad day, is what actually reveals whether a campaign is trending toward break-even.
A Full Sellvia Break-Even Example
Here is a complete, conservative example using the numbers from this guide:
- Subscription: $39/month
- Ads: $300/month, based on $10/day
- Optional tools: $0 in this conservative scenario
- Processing costs: variable, depending on order volume, not included in the fixed total below
Minimum break-even before processing costs in this example: $339/month.
This means that before a single processing fee is even counted, net earnings for the month need to exceed $339 for the store to be genuinely profitable. Order count by itself does not answer that question. Twenty orders at a poor net-commission-to-ad-cost ratio can still land below $339 in net earnings, while twelve orders at a strong ratio might clear it. The break-even gap, not the order count, is the number that actually tells the story.
How to Know If Sellvia Tools Are Actually Working
“More orders” is not, by itself, a sign that the tools are working. A beginner can generate a growing number of orders while still losing money on every one of them, as Scenario C above shows clearly. The more reliable signals to look for are:
- Cost per order is stable or decreasing over time, not drifting upward.
- Estimated net commission per order is consistently higher than cost per order, not just occasionally.
- The break-even gap gets smaller week by week, rather than staying flat or widening.
- Reports show repeatable order patterns tied to specific products, rather than random, unexplained spikes.
- Pending balance eventually converts into available balance at a predictable pace, rather than piling up indefinitely.
- Ad spend does not grow faster than net earnings; spend and earnings move together, not spend alone.
- Product selection becomes clearer over time, based on which items actually generate orders rather than guesswork.
When most of these signals point in the same direction, the toolset is doing its job: turning ad spend into orders that are actually worth having. When orders increase but the break-even gap does not shrink, the tools are producing activity, not progress, and that distinction is the one beginners most often miss.
When Beginners Should Not Scale Sellvia Ads Yet
Increasing a daily ad budget feels like the natural next step once a store has some order history, but scaling too early is one of the more expensive mistakes a beginner can make. It is worth pausing rather than increasing spend if any of the following are true:
- The current cost per order is not yet known with any confidence.
- Net commission per order is lower than cost per order, meaning each additional order at the current ratio adds to the loss rather than the profit.
- Processing costs have not been reviewed carefully, so the real net commission figure is still a guess.
- Most of the balance is still pending rather than available, which limits how much cash is actually on hand to fund a larger budget.
- There is not enough working capital to comfortably absorb a larger daily spend while waiting for payouts.
- Only a few days of data exist, which is not enough to separate a real trend from normal day-to-day variation.
- Orders are increasing, but the net result for the period is still negative.
None of this means a beginner should avoid ads altogether, and it is not a negative signal about the platform. It means that pausing, reviewing reports, and calculating cost per order against net commission is usually a smarter next step than increasing daily spend on a campaign that has not yet proven its ratio. Scaling a profitable ratio is a reasonable decision. Scaling an unproven or negative ratio mainly scales the loss.
Sellvia Payouts: Why Timing Affects Working Capital
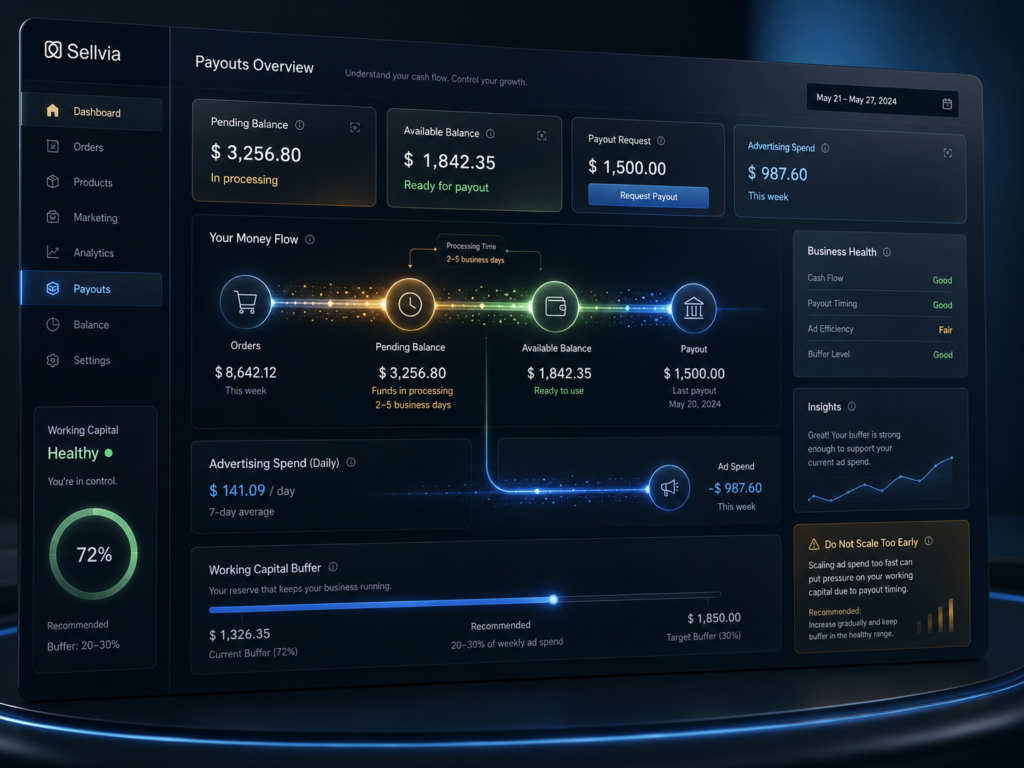
The payout area shows an earnings balance, generally split into pending and available amounts, along with a place to request a withdrawal once conditions are met. This section deserves specific attention because of a timing issue that is easy to overlook: advertising is typically paid on a daily or frequent basis, while earnings may not become available for withdrawal immediately.
There are a few reasons a user may need more working capital than the subscription and ad numbers alone suggest:
- Advertising costs are ongoing and due regardless of when orders convert into available funds
- Processing costs may need to be covered before or as part of receiving payout
- Earnings can sit in a pending state for a period before becoming available
- A minimum balance may need to be reached before a withdrawal can be requested at all
The exact minimum threshold and timing rules should be verified directly on the platform, since these details can change. The general principle, however, does not change: a beginner needs enough cash on hand to keep funding advertising while waiting for earlier orders to move through processing and into an available, withdrawable balance.
It helps to state this cash-flow pressure directly, because it is easy to underestimate. A beginner may pay for advertising every day, process a steady stream of orders throughout the month, and still be waiting for a meaningful share of those earnings to become available. This means the actual working capital needed can be higher than the visible monthly budget suggests, since spend happens continuously while payouts happen on their own schedule. A store can show a healthy number of orders on paper and still create real cash-flow pressure if payout timing consistently lags behind the pace of spending.
Sellvia Support: What It Helps With and What It Cannot Replace
Support is worth covering as its own tool rather than a footnote, because it shows up at nearly every stage of the workflow described in this guide. In practical terms, support is typically useful for:
- Initial setup questions when getting the store and dashboard configured
- Questions about activating advertising and understanding how the coupon or daily budget settings work
- Order processing questions, including how a specific order should be handled
- Payout questions, such as how the pending-to-available process works or what a minimum threshold currently is
- Account-level issues, such as billing, login, or technical errors inside the platform
What support does not do is make budget or product decisions on the user’s behalf. It cannot tell a beginner whether a specific product will convert, whether a given cost-per-order ratio is sustainable, or when it is safe to scale ad spend. Those are judgment calls that depend on the reports, order math, and break-even tracking covered earlier in this guide, not on a support conversation. Support is a tool for resolving platform questions; tracking numbers and interpreting them is still the user’s responsibility.
Sellvia Optional Upgrades: When They Make Sense
Optional upgrades, such as additional product packs, marketing tools, domain upgrades, and design enhancements, are worth evaluating with a simple return-on-investment question rather than buying by default.
Reasonable reasons to purchase an upgrade:
- The store already has consistent traffic and the current catalog is clearly too narrow for that audience
- Data from reports shows a specific bottleneck, such as weak conversion tied to store presentation
- A domain upgrade is being considered after the store already has order history and repeat visibility
Weak reasons to purchase an upgrade:
- Feeling stuck without a clear reason tied to data
- Assuming that more tools automatically produce more sales
- Expecting an upgrade to fix a problem that is actually about ad targeting or product fit
Sellvia Tools vs Building a Store Manually
| Area | Sellvia approach | Manual setup approach |
|---|---|---|
| Store | Ready-made store | Build from scratch |
| Products | Ready-made digital catalog | Create or arrange your own products |
| Ads | Built-in advertising system | Set up ad platforms manually |
| Orders | Dashboard-based workflow | Custom order system |
| Reports | Platform reporting | Separate analytics stack |
| Payouts | Platform payout flow | Independent payment processor setup |
| Control | Lower control, easier setup | Higher control, more complexity |
Neither approach is universally better. The comparison simply clarifies what is being traded: setup speed and integration on one side, independent ownership and flexibility on the other.
What Each Sellvia Tool Actually Helps You Decide
It helps to think of each tool in terms of the decision it supports, rather than as a standalone feature:
- Dashboard: Helps decide what needs attention today, including orders, balance, advertising status, and notifications.
- Product catalog: Helps decide which digital products actually fit the store’s niche and the audience being targeted.
- Built-in ads: Brings traffic, but it also creates the largest ongoing cost in the budget, so it drives most budget-related decisions.
- Order management: Helps track which sales are confirmed and what processing obligations follow from them.
- Reports: Help determine whether advertising is producing profitable orders or simply generating unprofitable activity.
- Payout tools: Help clarify when earnings actually become usable and whether enough working capital exists to keep operating in the meantime.
- Support: Helps resolve platform-specific questions, but it does not replace the business judgment needed to interpret reports or set a budget.
The Complete Sellvia Workflow, Step by Step
Putting every tool into a single sequence makes the full picture clear:
- The user signs up for Sellvia.
- The user gets access to the dashboard.
- The user reviews the digital product catalog.
- The user selects or activates specific products for the store.
- Store pages display those products to visitors.
- Built-in advertising sends traffic to the store.
- A customer places an order.
- The order appears in the dashboard.
- The user processes the order.
- A processing cost is deducted or paid as part of that step.
- The resulting commission moves through pending, then potentially incoming, then available status, depending on current platform rules.
- Once payout conditions are met, the user requests a withdrawal.
- Reports show whether the overall pattern is moving toward or away from break-even.
Step 9 in particular deserves more explanation than “the order gets processed.” A sale is not the same as instant profit. There is typically a processing cost attached. The user needs enough cash flow on hand to keep processing orders and funding ads at the same time. Earnings from a given order may not be available the same day. All of this means payout timing has a direct effect on how much working capital the business actually needs, not just on when the user gets paid.
Who Should Use Sellvia’s Tools?
Reasonable fit:
- A beginner who can realistically fund somewhere between $300 and $700 or more per month, based on the budget table above
- Someone who wants a structured, connected starting point rather than building a store from scratch
- Someone willing to check numbers daily or weekly, not just occasionally
- Someone who understands that advertising carries financial risk and can accept that going in
Poor fit:
- Someone who expects results from the $39/month subscription alone, with no advertising budget behind it
- Someone with no funds available for ongoing ad spend
- Someone who wants full manual control over advertising campaigns and targeting
- Someone unwilling to track cost per order and net commission on a regular basis
- Someone expecting guaranteed sales or profit regardless of budget or effort
What Sellvia’s Tools Do Not Do
To keep this guide balanced: these tools do not remove the financial risk of advertising, make every product convert, eliminate the need for cash-flow planning, replace business judgment about products or budget, speed up payout timing, or remove the need to understand the cost structure at each step. These are limitations of any connected platform, not a flaw unique to Sellvia, but they are worth stating clearly rather than glossing over.
Is Sellvia Tools Worth It for Beginners?
For beginners, Sellvia’s tools can be worth it if the user understands that the platform is not only a $39/month subscription. The real value is the connected workflow: products, ads, orders, reporting, and payouts are all handled inside one platform. That can save meaningful time compared with building a digital product store manually, since it removes most of the setup work covered in the comparison table above.
However, the platform makes the most sense for someone who has a realistic advertising budget and is willing to track performance using the kind of numbers covered in this guide. A beginner with only $39 available may misunderstand the model, because advertising and order processing can become much larger parts of the monthly cost than the subscription itself. The budget table earlier in this guide, ranging from $339 to $1,539 per month depending on ad spend, is a more accurate starting point for deciding whether the platform fits a given budget.
Final Verdict: Are Sellvia’s Tools Worth Using?
Sellvia’s tools are genuinely useful in a specific sense: they give a beginner a connected operating system for a digital product store, rather than a set of disconnected pieces that need to be assembled and maintained separately. The dashboard, product catalog, advertising system, order workflow, reports, and payout tools reduce the setup complexity that would otherwise require several separate platforms and a fair amount of technical work. The strongest value here is integration, not any single feature on its own.
At the same time, none of these tools should be treated as a profit guarantee. The real monthly cost includes the subscription, advertising spend that is typically several times larger than the subscription itself, processing costs tied to every order, and the time required to track performance carefully. A user who works through the numbers in this guide, tracks cost per order against net commission, and monitors the break-even gap week by week is in a far better position than someone who only looks at the $39/month price and assumes that is the full picture.
For a deeper look at overall platform impressions, see our Sellvia review. For a full cost breakdown, including advertising budget and break-even math, see our Sellvia pricing guide. For a broader explanation of the platform’s structure, see how Sellvia works. You can also browse all Sellvia articles for more beginner-focused guides.
Frequently Asked Questions
1. What tools does Sellvia include?
Sellvia includes a dashboard, a digital product catalog, a ready-made store, a built-in advertising system, order management, a reporting area, a balance and payout section, support access, and optional upgrades such as additional product packs or design enhancements.
2. How much do Sellvia’s tools cost?
Platform access starts at $39/month. Advertising is separate and typically ranges from $10 to $50 per day, which works out to roughly $300 to $1,500 per month depending on the budget chosen. Processing costs apply per order and are not fixed, and optional upgrades add further cost only if purchased.
3. Are Sellvia’s built-in ads included in the $39/month plan?
No. The subscription covers platform access only. Advertising spend is a separate, ongoing budget line that is usually the largest expense in running the store.
4. How much ad budget should a beginner expect?
Based on common daily budget levels of $10 to $50 per day, a realistic monthly range is about $300 to $1,500, before the subscription and before processing costs. Starting near the lower end while learning the platform is a common approach, but any specific recommendation should be weighed against personal financial circumstances.
5. How long does the $40 advertising coupon last?
It depends on the daily budget chosen. At $10/day it covers about 4 days, at $15/day about 2.6 days, at $20/day about 2 days, at $30/day about 1.3 days, and at $50/day less than 1 day. It is useful for an initial test but does not cover a full month of advertising at any common budget level.
6. Does Sellvia guarantee profit?
No. Access to the dashboard, product catalog, and advertising tools does not guarantee sales or profit. Outcomes depend on product selection, advertising performance, budget, processing costs, and how carefully the numbers are tracked over time.
7. What numbers should users track weekly?
At minimum: ad spend, number of orders, cost per order, estimated net commission per order, total processing costs, pending and available balance, and the break-even gap between total costs and total earnings for the period.
8. Is Sellvia better than building a digital product store manually?
It depends on priorities. Sellvia reduces technical setup by combining the store, catalog, advertising, orders, reports, and payouts into one platform, at the cost of less independent control. Building manually offers more control and ownership but requires considerably more time, technical skill, and separate tools to assemble the same functions.
Prices, tools, platform details, advertising terms, payout rules, margins, product catalog details, and available features may change. Readers should verify current information directly with Sellvia before making a decision.
6 responses to “Sellvia Tools Explained: Dashboard, Ads, Products, Orders, Reports, and Payouts”
-
[…] beyond the marketing copy. For a closer breakdown of every menu and tool in the dashboard, Sellvia dashboard tools covers that separately – this article stays focused on what the presence of those tools […]
-
I thought the $39 covered my real monthly cost – it doesn’t, and that gap between subscription price and actual ad spend is the number this post finally explains clearly. Cancelled two separate tools I was paying for just to handle what this platform does in one place, and the math on that alone justified it.
-
The part about realistic first-month costs being closer to $339 to $1,539 is the number I wish someone had put in front of me before I signed up – because I came in thinking $39 covered everything and had to recalibrate fast. What actually reduced my skepticism was not the marketing language but watching this platform process and report an actual order with actual math I could verify myself. The credibility is in the specifics, not the pitch.
-
I thought the $40 coupon was basically nothing against real ad costs – it wasn’t, because it covered exactly the window where my first sale came through while I was asleep.
-
The part this guide gets right – and that no review I read prepared me for – is that the ad system inside this platform essentially replaced two separate tools I was paying for elsewhere. What surprised me most was how the budget controls connected directly to the order and report views, so I was not jumping between three tabs trying to reconcile numbers manually.
-
The deposit mechanic for auto-processing was the specific detail that finally made the math click for me – I’d been comparing this platform against three separate tools I was already paying for, and the consolidated order flow alone justified the switch. Pending balance versus available balance is a real distinction that matters when you’re planning your next ad deposit, and I wish this breakdown had existed before I ran my own numbers on paper. Mildly surprised it works as cleanly as it does.



Daniel Roberts is an ecommerce writer and digital business researcher at Sellvia.biz. He specializes in exploring Sellvia’s tools, pricing, advertising features, order management processes, and overall platform structure. Through clear and practical articles, Daniel helps beginners understand how the platform works, estimate potential operating costs, compare available options, and make informed decisions when building an online business.
Leave a Reply