
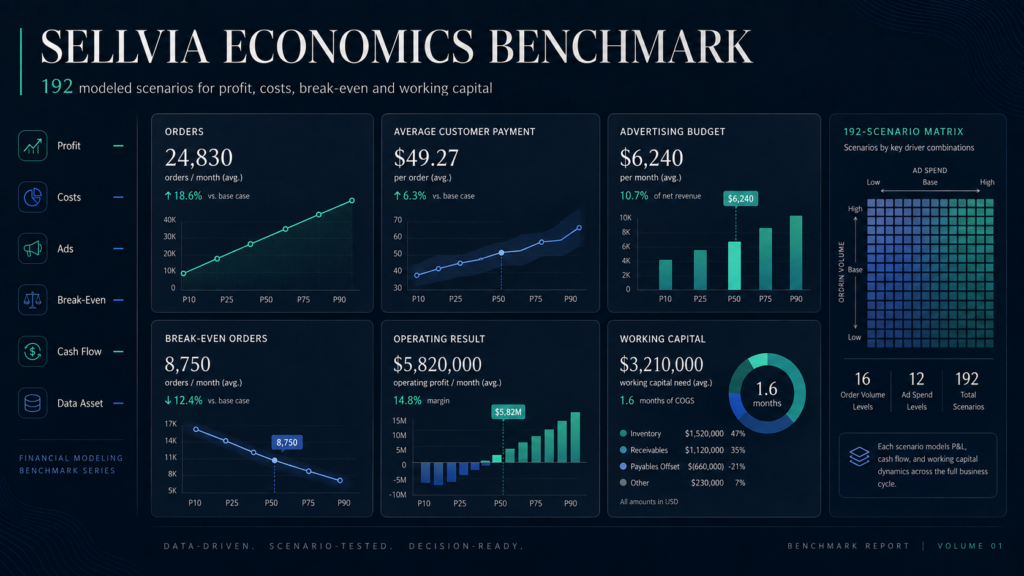
Sellvia Economics Benchmark 2026 · A data-driven analysis of Sellvia profit, advertising spend, break-even, cash requirements and order economics across multiple business scenarios.
Sellvia Economics Benchmark 2026 — Key Findings
- Average customer payment produces the largest operating-result swing across the tested ranges in this comparison. Holding order count (100), processing cost ($15) and ad spend ($600) constant, raising average payment from $25 to $100 moves the modeled operating result from −$282.00 to $5,793.00 — a swing of $6,075.00.
- Order volume produces the second-largest operating-result swing across the tested ranges in this comparison. Holding payment ($50), processing cost ($15) and ad spend ($600) constant, scaling from 25 to 250 orders moves the modeled operating result from −$169.50 to $5,568.00 — a swing of $5,737.50.
- Across the tested ranges in this 100-order / $50-payment base scenario, advertising spend produces about 1.5× the operating-result swing of processing cost. In the 100-order / $50-payment / $15-processing scenario, increasing advertising from $300 to $1,500 reduces the modeled operating result by $1,536.00 ($2,127.00 → $591.00) and raises calculator break-even orders from 17 to 77. Over the same scenario base, raising processing cost from $10 to $20 reduces the result by $1,000.00 ($2,243.00 → $1,243.00).
- Two scenarios with identical $5,000 revenue differ by $750.00 in the worked comparison. 50 orders × $100 payment and 100 orders × $50 payment both produce exactly $5,000.00 in gross customer payments, but the 50-order version returns a modeled operating result of $2,493.00 (49.86% margin) versus $1,743.00 (34.86% margin) for the 100-order version. The difference is driven by the order-processing payment applying to twice as many orders; the 19% referral fee is percentage-based and is therefore the same at equal gross revenue.
- The $39 subscription shrinks from 6.24% of revenue to 0.156% of revenue as scale increases. At $625 in gross customer payments it represents 6.24% of revenue; at $25,000 it represents 0.156% — a 40x dilution across the tested revenue range.
- 30.2% of the 192 modeled scenarios (58 of 192) do not clear a positive operating result under the tested combinations of low payment, high processing cost, and high advertising spend — confirming that volume alone does not guarantee profitability in this model.
- Calculator break-even can range from 14 to 96 orders within the same 100-order / $50-payment scenario depending only on processing cost ($10 vs. $20) and advertising budget ($300 vs. $1,500). The underlying theoretical values are 13.87 and 95.56, while the live calculator rounds required orders up to the next whole order.
- The highest modeled operating result in the dataset is $17,327.00 (250 orders, $100 average payment, $10 processing cost, $300 advertising budget — a 69.31% margin), while the lowest is −$1,952.75 (25 orders, $25 average payment, $20 processing cost, $1,500 advertising budget — a −312.44% margin, showing how a fixed ad budget applied to very few low-value orders overwhelms the model).
What This Benchmark Measures
Most public discussion of Sellvia economics reduces the platform to a single number: the $39 subscription, a claimed profit margin, or a headline “average” figure that has no defined denominator. None of those numbers explain how the underlying variables interact, and none of them let a reader test a different assumption.
This benchmark exists to close that gap. It takes four inputs that actually drive Sellvia store economics — processed order count, average customer payment, order-processing cost, and advertising budget — and calculates every combination across a defined range, producing 192 distinct scenarios. Instead of one number, the result is a matrix that shows how profit, margin, break-even, and cash requirements move as each input changes.
What was modeled: gross customer payments, Sellvia Payments referral fee, order-processing cost, the all-in advertising charge (including the ads management fee), the $39 subscription, and the resulting operating result, margin, and break-even point, plus a simplified view of how net commission splits between Available funds and Risk Reserve.
What was not modeled: refunds, disputes, chargebacks, taxes, currency conversion, “Other costs” such as domains or design services, and payout-method fees. These are excluded because they were not available as verified, reproducible figures — not because they are unimportant. See Methodology for the full list of exclusions.
Scenario analysis is more useful than a single average here because Sellvia stores do not share one order volume, one average sale price, or one advertising budget. A single “average Sellvia profit” figure would collapse four independent variables into one number and obscure exactly the relationships a prospective or current store owner needs to understand.
Methodology
The methodology below documents the core formulas, assumptions, exclusions, rounding conventions, and validation rules used for this benchmark.
Current platform-source check
Platform facts were cross-checked against current Sellvia public documentation before this audited version was prepared: Sellvia Terms of Use, Sellvia Dashboard | Fees, and Sellvia Dashboard | Balance and Payouts. Where public Sellvia sources conflict — notably the minimum withdrawal threshold — this benchmark avoids treating the disputed value as a profitability input and tells readers to verify the value shown in their own dashboard.
Core formulas (matching the calculation logic published in the Sellvia Profit Calculator):
| Gross customer payments | = Orders × Average customer payment |
| Total processing requirement | = Orders × Processing cost per order |
| Referral fee (19%) | = Gross customer payments × 0.19 |
| All-in ad charge | = Advertising budget + (Advertising budget × 28% ads management fee) |
| Modeled operating result | = Gross customer payments − Referral fee − Total processing requirement − All-in ad charge − Subscription ($39) − Performance tier cost − Other modeled costs |
| Theoretical break-even orders | = (All-in ad charge + Subscription + Tier + Other costs) ÷ Contribution per order before ads |
| Calculator break-even orders | = ceiling of the theoretical break-even result (the live calculator rounds up to the next whole order) |
| Net commission used by the calculator balance model | = Gross customer payments − Referral fee |
| Risk Reserve amount | = Net commission × 25% |
| Available after modeled hold | = Net commission − Risk Reserve |
Platform facts used as inputs: the benchmark uses the Sellvia PRO Basic subscription at $39/month; Sellvia’s current public terms also list Advanced ($99/month) and Ultimate ($299/month), which are not modeled here. Current Sellvia fee documentation lists a 28% Sellvia Ads fee and a 19% Sellvia Payments referral fee. Current balance documentation describes a 72-hour Incoming hold and a 25% Risk Reserve held for 125 days. Performance Tier weekly prices are Basic $0 / Plus $19 / Advanced $39 / Pro $69 / Elite $99, but current public terms state that thresholds and feature availability may vary, so the core dataset does not assign tiers automatically by order count.
Withdrawal-threshold note: current public Sellvia sources are not fully consistent: the Help Center states a $100 minimum per store, while the current Terms of Use state $100 for U.S. residents and $300 for residents of other countries. For that reason, the withdrawal threshold is not used as a profitability driver in the core dataset; readers should verify the value shown in their own dashboard.
Processing-payment note: “processing payment per order” in this benchmark is a user-entered modeling input — the amount paid to process one order, including displayed processing charges. It is not presented as a universal Sellvia processing-fee percentage.
Modeling assumptions: “Other costs” are set to $0; payout-method fees are set to $0 in the core dataset so the operating model is not tied to a specific withdrawal method; one monthly period is used per scenario; Performance Tier cost is set to $0 in the core dataset because current public terms do not publish a stable order-count threshold that can be applied automatically to every account. Readers can select the tier actually shown in their account in the Sellvia Profit Calculator.
Every figure in this article was generated programmatically from the same dataset published as a downloadable CSV, then checked with automated validation: no negative order counts, no division-by-zero conditions, and confirmation that raising processing cost or advertising spend never increased the modeled operating result when all other inputs were held constant, while raising average payment never decreased contribution after ads. Full documentation of both the Sellvia pricing structure and the Sellvia break-even analysis is available on dedicated pages; this page does not repeat that explanatory content and instead links to it where relevant.
The 192-Scenario Sellvia Economics Dataset
The dataset varies four inputs: processed orders (25, 50, 100, 250), average customer payment ($25, $50, $75, $100), order-processing cost ($10, $15, $20 per order), and Sellvia Ads media budget ($300, $600, $900, $1,500). Every combination is calculated, producing 4 × 4 × 3 × 4 = 192 rows, each with more than two dozen calculated fields covering revenue, cost, margin, break-even, and cash-flow metrics.
The table below shows a representative 12-row subset: 100 orders at a $50 average payment across all three processing-cost levels and all four advertising-budget levels. This subset alone illustrates how much the result moves before volume or price change at all. The full benchmark is based on 192 programmatically generated scenario combinations; the representative tables below show the most decision-relevant comparisons.
| Processing cost | Ad budget | All-in ad charge | Operating result | Margin | Break-even orders |
|---|---|---|---|---|---|
| $10 | $300 | $384.00 | $2,627.00 | 52.54% | 14 |
| $10 | $600 | $768.00 | $2,243.00 | 44.86% | 27 |
| $10 | $900 | $1,152.00 | $1,859.00 | 37.18% | 40 |
| $10 | $1,500 | $1,920.00 | $1,091.00 | 21.82% | 65 |
| $15 | $300 | $384.00 | $2,127.00 | 42.54% | 17 |
| $15 | $600 | $768.00 | $1,743.00 | 34.86% | 32 |
| $15 | $900 | $1,152.00 | $1,359.00 | 27.18% | 47 |
| $15 | $1,500 | $1,920.00 | $591.00 | 11.82% | 77 |
| $20 | $300 | $384.00 | $1,627.00 | 32.54% | 21 |
| $20 | $600 | $768.00 | $1,243.00 | 24.86% | 40 |
| $20 | $900 | $1,152.00 | $859.00 | 17.18% | 59 |
| $20 | $1,500 | $1,920.00 | $91.00 | 1.82% | 96 |
Even within this single 12-row slice — order count and average payment held perfectly constant — the modeled operating result ranges from $91.00 to $2,627.00, and the live calculator’s rounded break-even requirement ranges from 14 to 96 orders. Processing cost and advertising budget alone account for that entire spread.
How Order Volume Changes Sellvia Economics
Holding average payment at $50, processing cost at $15, and advertising at $600, scaling order volume changes fixed-cost dilution, advertising cost per order, and total processing capital simultaneously.
| Orders | Fixed cost/order | Ad cost/order | Processing capital | Operating result | Margin |
|---|---|---|---|---|---|
| 25 | $1.56 | $30.72 | $375.00 | −$169.50 | −13.56% |
| 50 | $0.78 | $15.36 | $750.00 | $468.00 | 18.72% |
| 100 | $0.39 | $7.68 | $1,500.00 | $1,743.00 | 34.86% |
| 250 | $0.16 | $3.07 | $3,750.00 | $5,568.00 | 44.54% |
Two things happen at once as order count rises with a fixed $600 ad budget: the all-in ad cost per order falls from $30.72 to $3.07 (the same $768 all-in ad charge spread across more orders), while total processing capital rises linearly from $375 to $3,750 (more orders each requiring their own processing payment). In this scenario, volume helps because the fixed ad budget dilutes faster than processing cost accumulates. That relationship reverses in the advertising sensitivity table below, where volume is fixed and ad budget rises instead — in that case, more advertising spend increases break-even without adding a single order. Volume improves economics when it dilutes a fixed cost; it does not automatically improve economics if the added orders bring their own proportional advertising cost.
How Average Customer Payment Changes Profitability
Holding order count at 100, processing cost at $15, and advertising at $600, raising the average customer payment increases revenue faster than it increases any single cost line, because processing cost and the $39 subscription do not scale with price at all, and the referral fee scales at a fixed 19% regardless of price level.
| Avg. payment | Revenue | Operating result | Margin | Break-even orders |
|---|---|---|---|---|
| $25 | $2,500.00 | −$282.00 | −11.28% | 154 |
| $50 | $5,000.00 | $1,743.00 | 34.86% | 32 |
| $75 | $7,500.00 | $3,768.00 | 50.24% | 18 |
| $100 | $10,000.00 | $5,793.00 | 57.93% | 13 |
At $25 average payment, this particular 100-order / $15-processing / $600-ad combination does not clear break-even — the live calculator rounds the break-even requirement to 154 orders at that price point, far more than the 100 orders actually modeled. Raising average payment to $50 drops the calculator break-even requirement to 32 orders, comfortably below the 100 modeled. This is the clearest example in the dataset of how average order value, not order count, determines whether a fixed advertising budget is recoverable at all.
How Processing Cost Changes the Model
Holding order count at 100, average payment at $50, and advertising at $600, each $1 increase in per-order processing cost removes exactly $100 from the modeled operating result at this order volume — mechanically, because processing cost is multiplied by order count with no other variable involved.
| Processing cost/order | Total processing requirement | Operating result | Margin | Break-even orders |
|---|---|---|---|---|
| $10 | $1,000.00 | $2,243.00 | 44.86% | 27 |
| $15 | $1,500.00 | $1,743.00 | 34.86% | 32 |
| $20 | $2,000.00 | $1,243.00 | 24.86% | 40 |
Rising from $10 to $20 processing cost per order removes exactly $1,000.00 from the modeled operating result across these 100 orders and pushes the calculator break-even requirement from 27 to 40 orders. Because processing cost is a linear per-order cost with no volume discount modeled, its effect scales directly with order count — at 250 orders the same $10 increase would remove $2,500.00 instead of $1,000.00.
How Advertising Spend Changes Break-Even
Holding order count at 100, average payment at $50, and processing cost at $15, advertising is the input most directly tied to break-even orders in this model, because it is the only cost applied as a fixed budget rather than a per-order charge.
| Ad budget | Ad cost/order | Ad share of revenue | Operating result | Break-even orders |
|---|---|---|---|---|
| $300 | $3.84 | 7.68% | $2,127.00 | 17 |
| $600 | $7.68 | 15.36% | $1,743.00 | 32 |
| $900 | $11.52 | 23.04% | $1,359.00 | 47 |
| $1,500 | $19.20 | 38.40% | $591.00 | 77 |
Moving from a $300 to a $1,500 advertising budget at a fixed 100 orders pushes advertising’s share of revenue from 7.68% to 38.40% and raises the calculator break-even requirement from 17 to 77 orders. At this order volume and $15 processing payment, total processing payments equal $1,500. The all-in ad charge exceeds that amount only when the media budget rises above about $1,172; among the tested points, that occurs at the $1,500 media-budget scenario. This is why the calculator’s own guidance treats advertising efficiency, not the $39 subscription, as the variable most worth tracking closely once a store is spending meaningfully on ads.

Same Revenue, Different Economics
Two scenarios can produce identical gross customer payments while returning different operating results because the processing payment is applied per order. The 19% referral fee is percentage-based, so at identical gross revenue it is the same in both scenarios.
| Scenario | Orders × payment | Revenue | Processing capital | Operating result | Margin |
|---|---|---|---|---|---|
| A | 50 × $100 | $5,000.00 | $750.00 | $2,493.00 | 49.86% |
| B | 100 × $50 | $5,000.00 | $1,500.00 | $1,743.00 | 34.86% |
Both scenarios use the same $15 processing cost per order and the same $600 advertising budget. Scenario A (50 higher-value orders) requires $750.00 of processing capital and returns a $2,493.00 modeled operating result. Scenario B (100 lower-value orders producing the same $5,000.00 revenue) requires exactly twice the processing capital — $1,500.00 — because processing cost is charged per order, not per dollar. The result: identical revenue, but a $750.00 difference in operating result and nearly 15 percentage points of margin. Same revenue does not mean the same cost structure. Order count multiplies every per-order cost line independently of price, which is why two stores that look identical on a revenue dashboard can carry very different profitability.

How Fixed Costs Behave as Revenue Grows
The $39 monthly subscription is the same dollar amount regardless of scenario size, which means it represents a shrinking share of revenue as gross customer payments rise.
| Revenue level | $39 ÷ revenue |
|---|---|
| $625 | 6.24% |
| $1,250 | 3.12% |
| $2,500 | 1.56% |
| $5,000 | 0.78% |
| $10,000 | 0.39% |
| $25,000 | 0.156% |
At the lowest revenue level in the dataset ($625, from 25 orders at $25 average payment), the subscription represents 6.24% of revenue. At the highest revenue level ($25,000, from 250 orders at $100 average payment), it represents 0.156% — a roughly 40x dilution. This confirms the pattern also identified in Sellvia.biz’s dedicated break-even analysis: the subscription is rarely the deciding factor once a store processes any meaningful order volume. Advertising efficiency and processing cost matter far more at scale.
Performance Tier cost sensitivity (separate illustration)
The core 192-scenario dataset does not auto-assign a Performance Tier because current public terms say tier thresholds and feature availability may vary by account. To show the pure cost effect without inventing an order threshold, take the 100-order / $50-payment / $15-processing / $600-ad scenario and apply four weekly charges for a selected tier:
| Selected tier | 4-week tier cost | Modeled operating result | Calculator break-even orders |
|---|---|---|---|
| Basic | $0 | $1,743.00 | 32 |
| Plus | $76 | $1,667.00 | 35 |
| Advanced | $156 | $1,587.00 | 38 |
| Pro | $276 | $1,467.00 | 43 |
| Elite | $396 | $1,347.00 | 48 |
This is a sensitivity illustration only. It shows what the weekly subscription amount does to the model if that tier is actually selected or shown in the user’s account; it does not claim that any specific order count automatically triggers that tier.
Sellvia Working Capital and Cash Requirements
A positive modeled operating result is not the same as immediately available cash. The Sellvia cash flow guide covers the Pending, Incoming, Available, and Risk Reserve stages in full; this section connects those stages to the benchmark dataset using one worked scenario.
| Metric | Amount |
|---|---|
| Gross customer payments | $5,000.00 |
| Net commission used by calculator balance model | $4,050.00 |
| Risk Reserve (25%) | $1,012.50 |
| Available after Incoming hold (75%) | $3,037.50 |
| Working capital required (ads + processing + subscription) | $2,307.00 |
| Minimum withdrawal status | Reaches the ~$100 minimum |
In this scenario, $2,307.00 of external cash is committed before the period’s earnings cycle completes — the $768.00 all-in ad charge, $1,500.00 of processing capital, and the $39.00 subscription. Under the uploaded calculator logic, gross customer payments of $5,000.00 minus the 19% referral fee produce $4,050.00 of net commission for the balance model. Of that amount, $3,037.50 becomes Available after the modeled Incoming hold and $1,012.50 is assigned to Risk Reserve for the validation window described in Sellvia’s terms as up to 125 days. The modeled operating result of $1,743.00 is an accounting figure for the period — it does not mean $1,743.00 is sitting in a bank account on day one. This is precisely the distinction Sellvia.biz’s cash-flow and break-even guides describe as accounting break-even versus cash-flow break-even, and it is the reason this benchmark reports profitability and liquidity as separate figures rather than collapsing them into one number.

Sellvia Break-Even Map
Break-even orders respond to processing cost and advertising budget simultaneously. The map below holds order count (100) and average payment ($50) constant and varies only processing cost and ad budget across their low and high tested values.
| Ad budget: $300 (low) | Ad budget: $1,500 (high) | |
|---|---|---|
| Processing cost: $10 (low) | 14 orders | 65 orders |
| Processing cost: $20 (high) | 21 orders | 96 orders |
The lowest-cost combination in this map (low processing, low ads) requires 14 calculator break-even orders — comfortably below the 100 orders actually modeled. The highest-cost combination (high processing, high ads) requires 96 calculator break-even orders — nearly the full 100 modeled, leaving almost no margin for a slow week, a refund, or a conversion-rate dip. The difference between the rounded calculator requirements is 82 orders, illustrates how much a store’s practical safety margin depends on cost discipline rather than order volume alone.
Highest Modeled Operating Results Under the Tested Assumptions
These are not “the best Sellvia stores” — they are the five highest operating results the model produces within the tested input ranges, and they share a common pattern.
| Orders | Payment | Processing | Ad budget | Operating result | Margin |
|---|---|---|---|---|---|
| 250 | $100 | $10 | $300 | $17,327.00 | 69.31% |
| 250 | $100 | $10 | $600 | $16,943.00 | 67.77% |
| 250 | $100 | $10 | $900 | $16,559.00 | 66.24% |
| 250 | $100 | $15 | $300 | $16,077.00 | 64.31% |
| 250 | $100 | $10 | $1,500 | $15,791.00 | 63.16% |
Every one of the top five modeled results shares the highest tested order count (250) and the highest tested average payment ($100). This is a direct consequence of the earlier sensitivity findings: average payment and order volume are the two most sensitive variables, so the highest results in the dataset are concentrated where both are set to their maximum tested value, with processing cost and advertising budget acting as smaller secondary factors.
Most Challenging Modeled Scenarios
The lowest modeled results share the opposite pattern: the lowest tested order count, the lowest tested average payment, and the highest tested advertising budget.
| Orders | Payment | Processing | Ad budget | Operating result | Margin |
|---|---|---|---|---|---|
| 25 | $25 | $20 | $1,500 | −$1,952.75 | −312.44% |
| 50 | $25 | $20 | $1,500 | −$1,946.50 | −155.72% |
| 100 | $25 | $20 | $1,500 | −$1,934.00 | −77.36% |
| 250 | $25 | $20 | $1,500 | −$1,896.50 | −30.34% |
| 25 | $25 | $15 | $1,500 | −$1,827.75 | −292.44% |
These combinations do not reach modeled break-even because a $1,500 fixed advertising budget applied to a low average payment overwhelms the contribution available from the tested order counts, and rising processing cost compounds the shortfall further. This does not describe a failing business in the real world — it describes what happens mathematically when a fixed advertising budget is set far above what the tested order volume and price point can absorb. The practical implication, consistent with the calculator’s own guidance, is that advertising budget should scale with demonstrated order volume and average payment, not be set independently of them.
What Actually Drives the Economics?
Ranking the four tested variables by the size of the operating-result swing produced across their full tested range, holding the other three at their mid-range value (100 orders, $50 payment, $15 processing, $600 ads):
| Rank | Variable | Tested range | Operating-result swing |
|---|---|---|---|
| 1 | Average customer payment | $25 → $100 | $6,075.00 |
| 2 | Order volume | 25 → 250 orders | $5,737.50 |
| 3 | Advertising budget | $300 → $1,500 | −$1,536.00 |
| 4 | Processing cost | $10 → $20/order | −$1,000.00 |
Average customer payment and order volume both move revenue directly and therefore produce the largest swings across their tested ranges. Advertising budget and processing cost are cost lines rather than revenue lines, so their tested ranges — while still meaningful, particularly for break-even — produce smaller absolute swings in this specific mid-range comparison. This ranking is specific to the mid-range point chosen; at a lower order count or lower average payment, advertising budget’s relative importance increases, as shown in the average-payment sensitivity table above, where a $600 ad budget is unrecoverable at $25 average payment but comfortably covered at $100.
Find Your Closest Sellvia Economics Scenario
Select four benchmark assumptions. The tool instantly matches them to one of the 192 modeled scenarios used in this research and calculates the same core metrics.
This is a hypothetical benchmark scenario, not actual or guaranteed user performance. “Near Break-Even” means the modeled operating margin is between −5% and +5%.
Need More Control?
The Scenario Finder uses the benchmark’s predefined values. For custom order counts, custom payment values, payout settings and additional costs, use the Sellvia Profit Calculator.
How to Interpret the Data
A few interpretation rules apply across every section above:
Correlation is not causation. The dataset shows what happens to the modeled operating result when a defined input changes while others are held constant. It does not show what will happen to any specific account, because a real store rarely changes exactly one variable at a time.
Modeled result is not actual result. Every figure in this article was generated from the stated formulas and stated inputs. None of it was taken from an observed account.
Advertising efficiency matters more than the subscription at any meaningful scale. The fixed-cost dilution table and the advertising sensitivity table both point to the same conclusion from different angles.
Cash flow and accounting profit are different questions. The working capital section above shows a scenario with a positive operating result and a Risk Reserve balance that will not be Available for the modeled validation window.
Higher revenue is not automatically higher profit. The same-revenue comparison table is the clearest illustration: identical $5,000.00 revenue, $750.00 difference in operating result, because order count multiplies per-order costs independently of price.
Verification note
Platform-specific fees, balance rules and subscription figures used in this model were checked against current Sellvia public documentation when this benchmark was reviewed in August 2026. Because account terms and thresholds can change, readers should verify current values in their own Sellvia dashboard before using the model for a financial decision.
Research Limitations
- This is a modeled dataset generated from defined assumptions, not a sample of actual Sellvia accounts.
- Real Sellvia stores experience variable advertising performance, conversion rates, refund rates, and processing costs that can fall outside the ranges tested here.
- Platform fees, tier pricing, the Risk Reserve percentage, the validation window, and payout terms can change after this benchmark’s publication date. Confirm current figures against the live Sellvia dashboard and official Terms of Use before making a financial decision.
- Payout-method fees, “Other costs” (domains, tools, design services), refunds, disputes, and taxes are not included in the core dataset; see the Methodology file for the full list of exclusions.
- No scenario in this dataset guarantees a future result. Different order volumes, price points, processing costs, and advertising budgets will produce different modeled outcomes, and a real account’s actual outcome depends on factors this model does not attempt to capture.
Frequently Asked Questions
How much does Sellvia cost at different order volumes?
The $39 subscription is fixed regardless of order volume, but total cost also depends on processing cost per order and the advertising budget chosen, both of which scale with the scenario. See the order-volume and fixed-cost-dilution sections above for exact figures across the tested range.
What affects Sellvia break-even the most?
In this benchmark, average customer payment and advertising budget have the largest effect on break-even orders, because break-even is calculated as fixed and advertising costs divided by net profit per order — a low average payment or a high advertising budget both push that denominator down or the numerator up. See the Break-Even Map above for exact figures.
Does higher revenue always mean higher profit?
No. The Same Revenue, Different Economics section shows two scenarios with identical $5,000.00 revenue producing a $750.00 difference in modeled operating result, because order count multiplies per-order processing cost independently of price.
How does advertising spend affect Sellvia economics?
Advertising is modeled as a fixed period budget rather than a per-order cost, so it directly affects break-even orders and, once it grows past a certain share of revenue, becomes the largest single cost line in the model — larger than processing cost in several tested scenarios. See the Advertising Sensitivity section above.
How much working capital can Sellvia require?
In the worked example above (100 orders, $50 payment, $15 processing, $600 ads), $2,307.00 of external cash is committed before the period’s earnings cycle completes. Under the uploaded calculator’s balance logic, $3,037.50 of net commission becomes Available after the modeled Incoming hold, while $1,012.50 is assigned to Risk Reserve. See the Working Capital section for the full breakdown.
Why can two stores with the same revenue have different profit?
Because the order-processing payment is applied per order. The 19% referral fee is percentage-based, so it is the same when gross revenue is identical; the processing-payment total is what creates the difference in the worked comparison. See the Same Revenue, Different Economics section.
How was the Sellvia Economics Benchmark calculated?
Using the formula structure published in the Sellvia Profit Calculator, applied programmatically across 192 combinations of order count, average payment, processing cost, and advertising budget. The core formulas and assumptions are documented in the Methodology section above.
Are these real Sellvia user results?
No. Every figure in this benchmark is a modeled calculation from defined inputs, not observed data from any Sellvia account.
Can I calculate my own Sellvia scenario?
Yes. The Sellvia Profit Calculator lets you enter your own order volume, average payment, processing cost, advertising budget, and additional fields such as payout method and other costs, which this benchmark holds at fixed modeling defaults for consistency across all 192 scenarios.
7 responses to “Sellvia Economics Benchmark”
-
the same-revenue-different-economics table finally explained something confusing me for months. two stores can hit identical $5,000 and have wildly different actual profit depending purely on order count vs average payment
-
the point about advertising being a fixed budget while processing scales per order is the clearest explanation of why my break-even number moves so much between months, even when revenue looks stable
-
appreciate that this doesn’t pretend these are real observed accounts, the constant “modeled not actual” framing is refreshing compared to most content that implies these numbers are typical
-
the 40x subscription dilution table put something in perspective for me, i’d been mentally treating $39 as a meaningful cost way longer than the math actually supports once volume picks up
-
the working capital section is what i needed months ago. seeing a positive operating result next to a completely separate cash requirement number finally explained why i felt broke during a technically profitable month
-
The 60-day seasoning window before listing on Sellvia Market is the part nobody talks about – and honestly it’s the part that made me take the store seriously instead of treating it like a side experiment I’d abandon by month two (which, fair, was my original plan).
-
[…] Sellvia Economics Benchmark is useful for comparing how order volume and cost assumptions change the broader model, while the […]



Erick Borth is an ecommerce writer and digital platform researcher at Sellvia.biz. He covers Sellvia’s business tools, subscription options, built-in advertising features, order processing, analytics, and financial workflows. Erick focuses on presenting platform information in a clear and practical way, helping beginners understand how Sellvia operates, identify the costs involved, evaluate its features, and make informed decisions about starting and managing an online business.
Leave a Reply